When the test has finished, the test graph is displayed in the "Graph Area" and the selected
results are displayed in the "Test Results" area to the left of the graph as shown below. We
can have the “Results” or “Statistics” screen appear at the end of the test instead of the
“Graph” screen. The CSx application will remember the screen that was showing when the
test was started, then return to this screen at the end of the test.
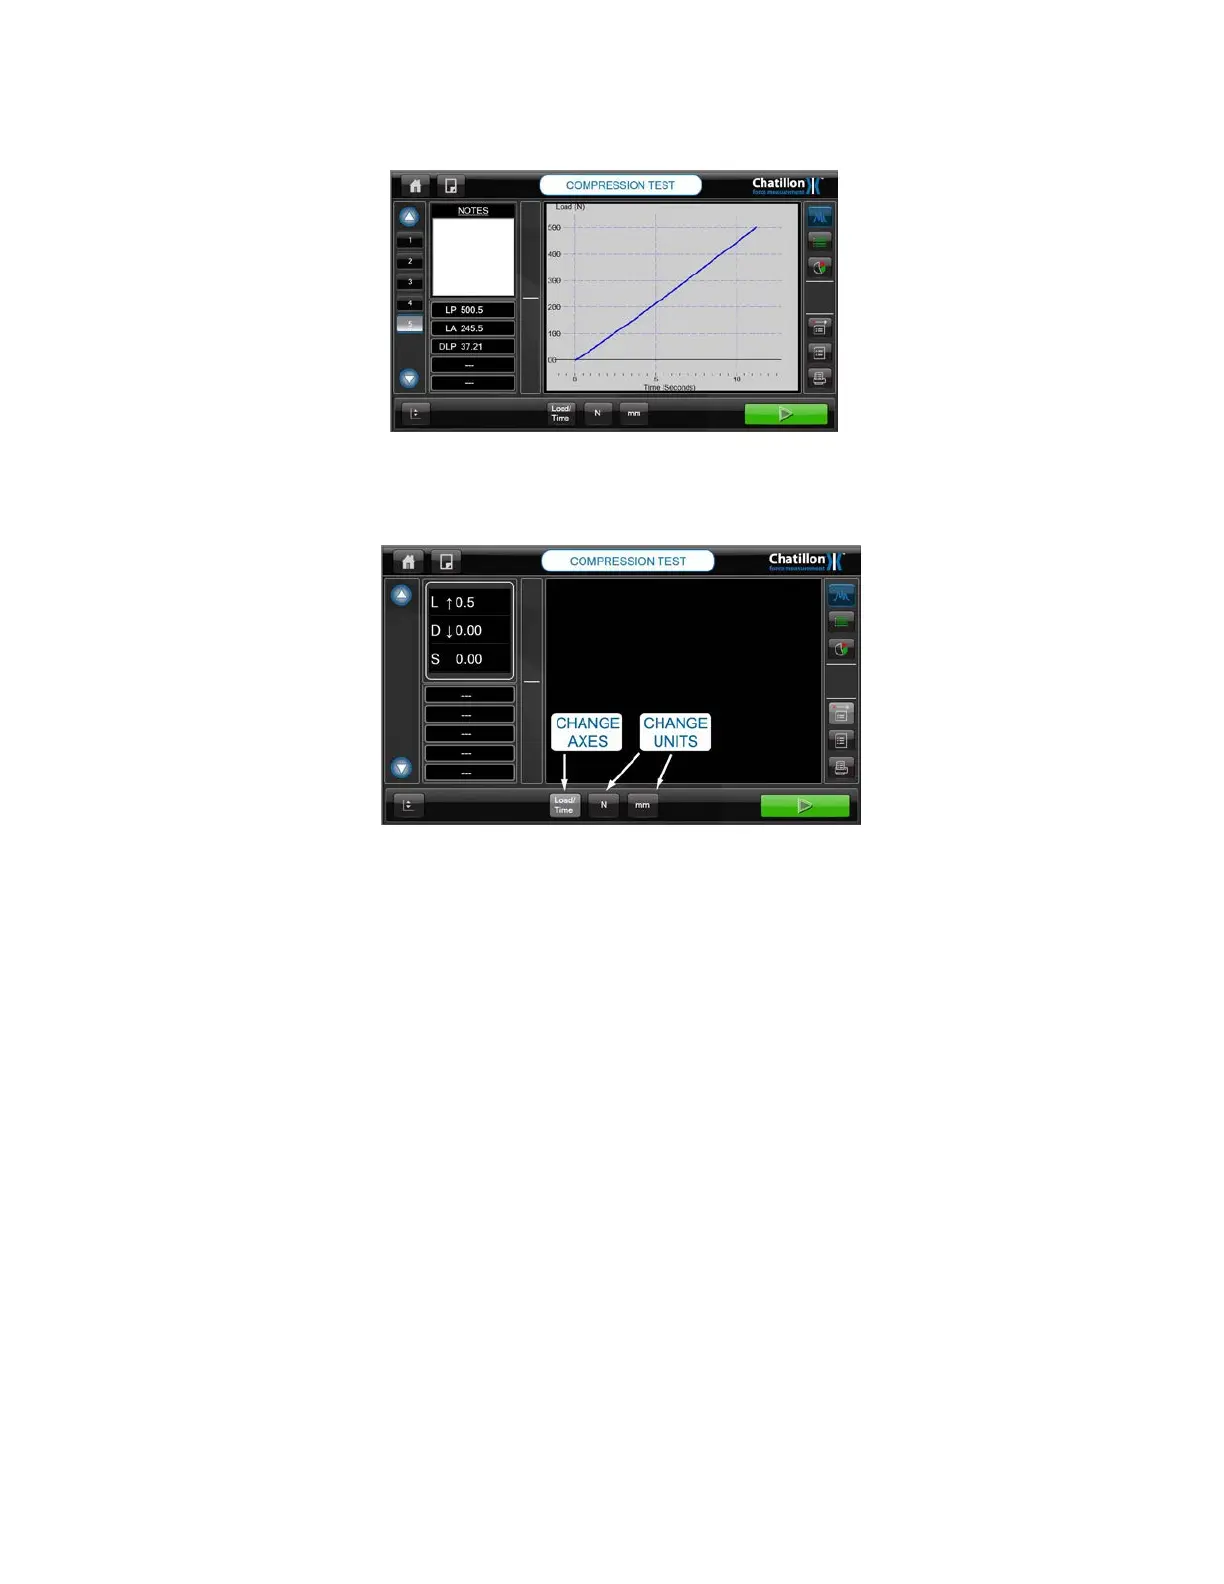
The picture above shows the default graph axes of Load / Time.
Other axes of Distance / Time and Load / Distance are available and the graph will cycle
through the available axes by repeatedly pressing the "CHANGE AXES" button.
Therefore, pressing the “CHANGE AXES" button changes the graph to show Distance / Time
as shown below.
80 CS User Manual
 Loading...