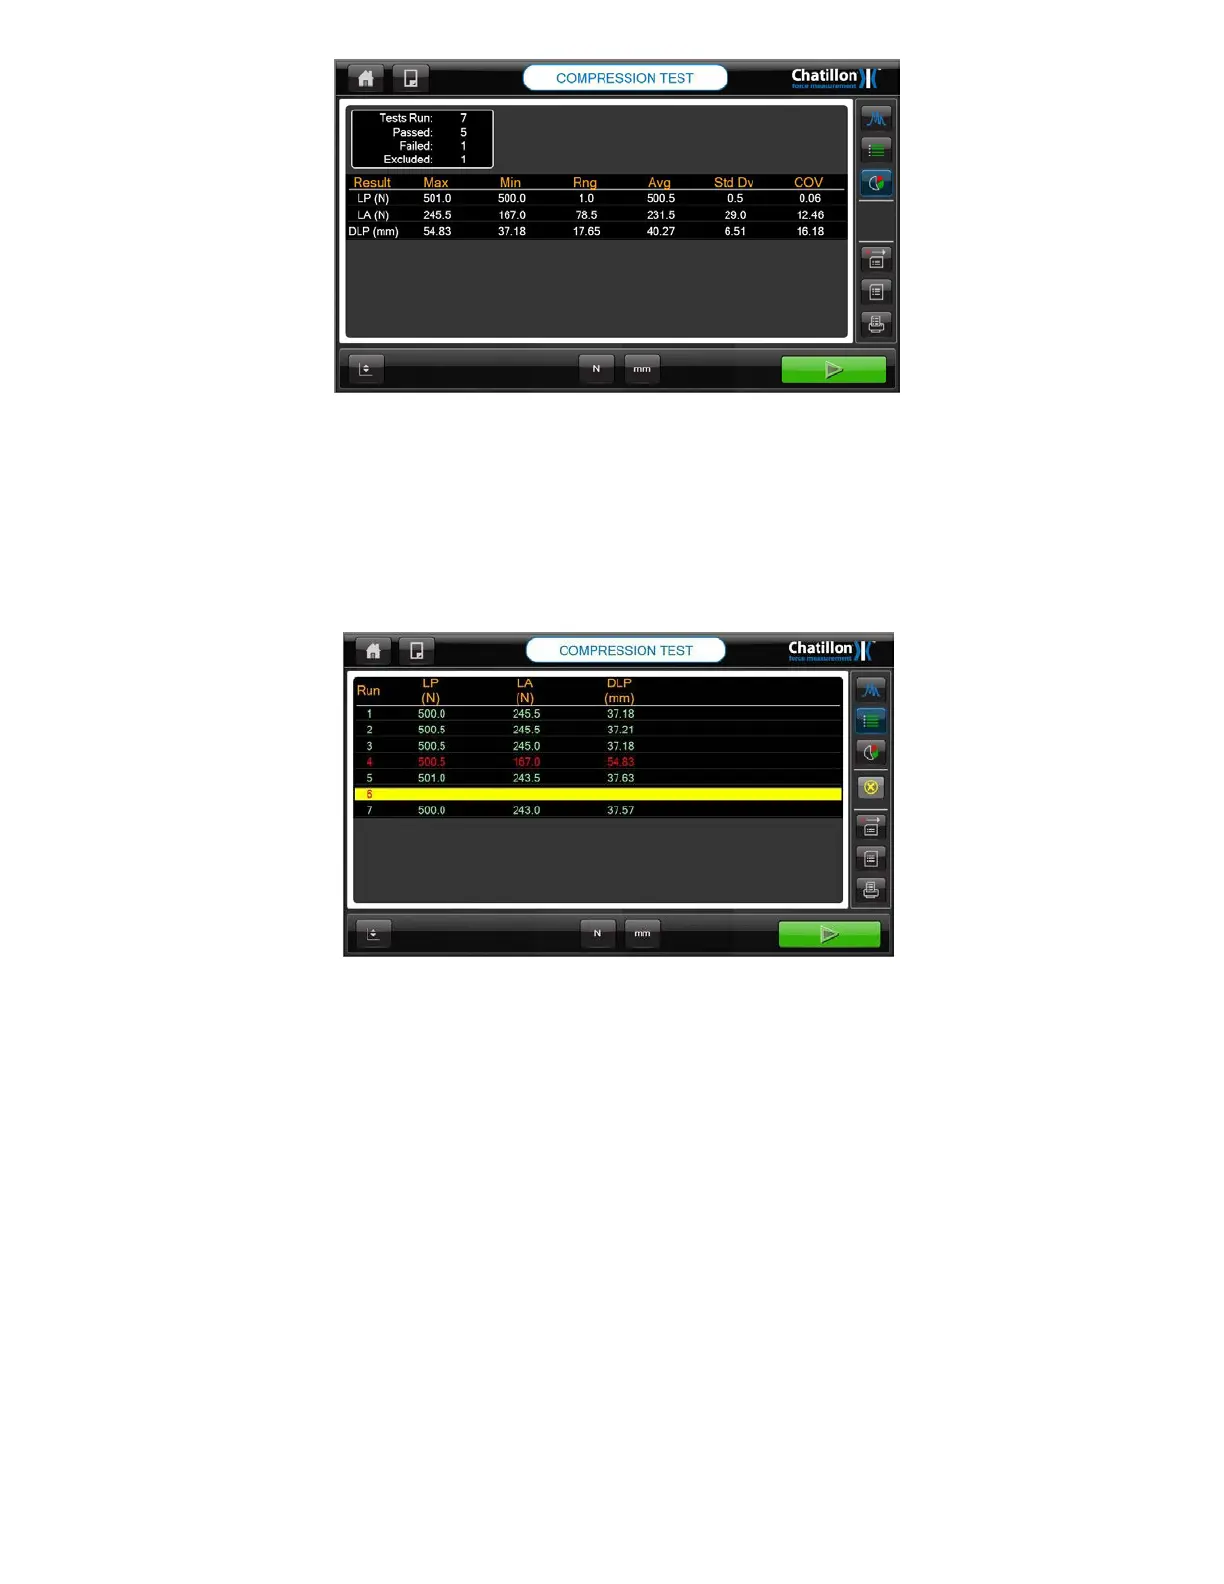
The test statistics are shown above. The top left area shows the test status for every test.
The test status is normally the pass/fail status and the example screen shows that 7 samples
were tested and that 5 samples passed, 1 sample failed and 1 sample was excluded.
The formula used to calculate the standard deviation uses the divide by "n" method so is the
same as the Excel STDDEVP method. The standard deviation is a measure of how widely
values are dispersed from the average value (the mean).
The test results for a bad test (e.g. test number 5 where the sample was too thin) can be
excluded from the statistics by pressing on the required sample number (may need to use a
stylus) then pressing on the yellow "X" displayed on the right hand side of the screen.
The selected test is shown with a yellow background in the data table and this test is
excluded (removed) from the statistics as shown below.
CS User Manual
87
 Loading...