This signal contains contributions from harmonic distortion (at 2 kHz, 3 kHz, and 4
kHz), an interfering tone (at 490 Hz), random noise, and 60 Hz hum. The THD+N
measurement includes all of these, and reads 0.229 %.
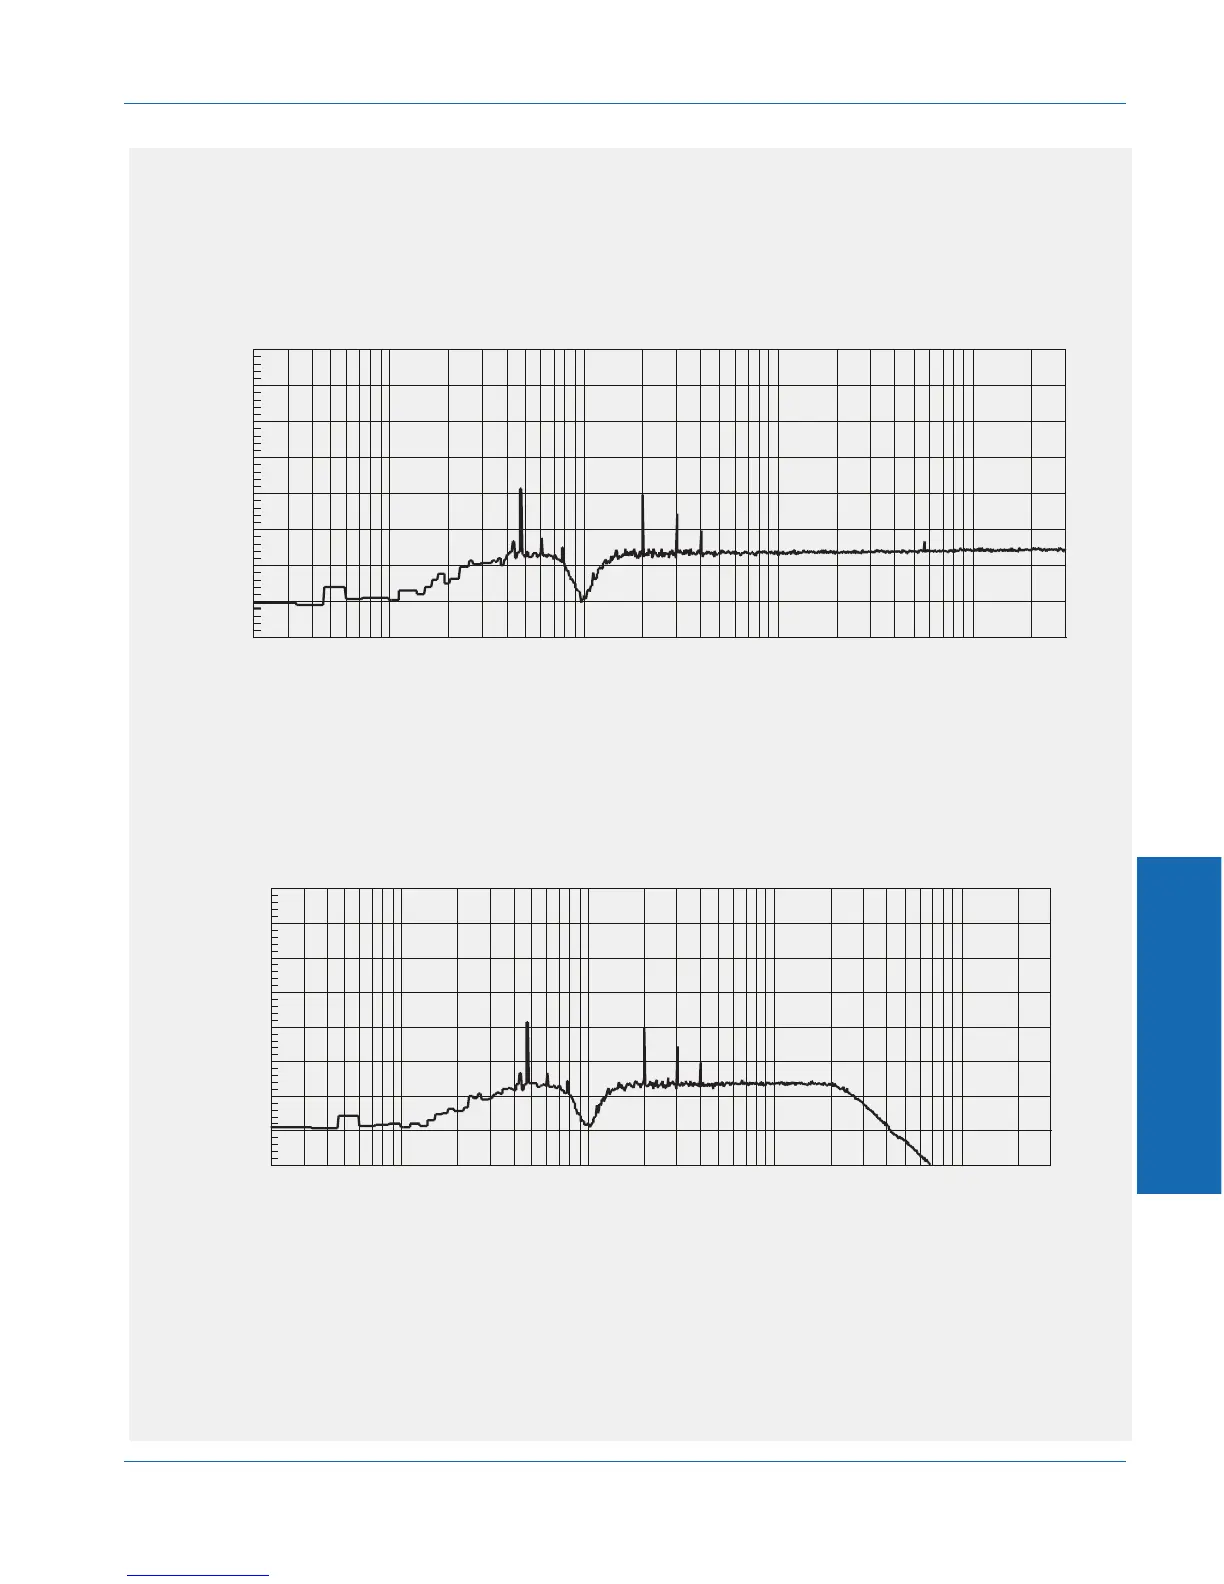
If we use the 400 Hz bandpass filter to eliminate the hum, the spectrum of the signal
then looks like this:
The THD+N now measures 0.185 %. From this, we can determine that the hum
product was contributing 0.044 % to the THD+N reading.
Next, we can invoke the 22 kHz lowpass filter to eliminate the high-frequency noise.
The spectrum now looks like this:
The THD+N still measures 0.185 %. From this, we can determine that (in this particular
case) the high-frequency noise did not make a significant contribution to the
measurement. It is dominated by the distortion and interference tones.
-140
+20
-120
-100
-80
-60
-40
-20
+0
20 50 100 200 500 1k 2k 5k 10k 20k 50k
Hz
d
B
r
A
200k100k 300k
Figure 4-13. Spectrum with 400 Hz bandpass filter applied
-140
+20
-120
-100
-80
-60
-40
-20
+0
d
B
r
A
20 50 100 200 500 1k 2k 5k 10k 20k 50k
Hz
200k100k 300k
Figure 4-14. Spectrum with 22 kHz lowpass filter added
4 Functions
Function Descriptions THD+N (Total Harmonic Distortion plus Noise)
ATS-1 Dual Domain User's Manual 4-15