USER’S MANUAL / bit Tune /
34
4. IN: Indicates the active input selected for the measurement (see sect. 3.3 point 6).
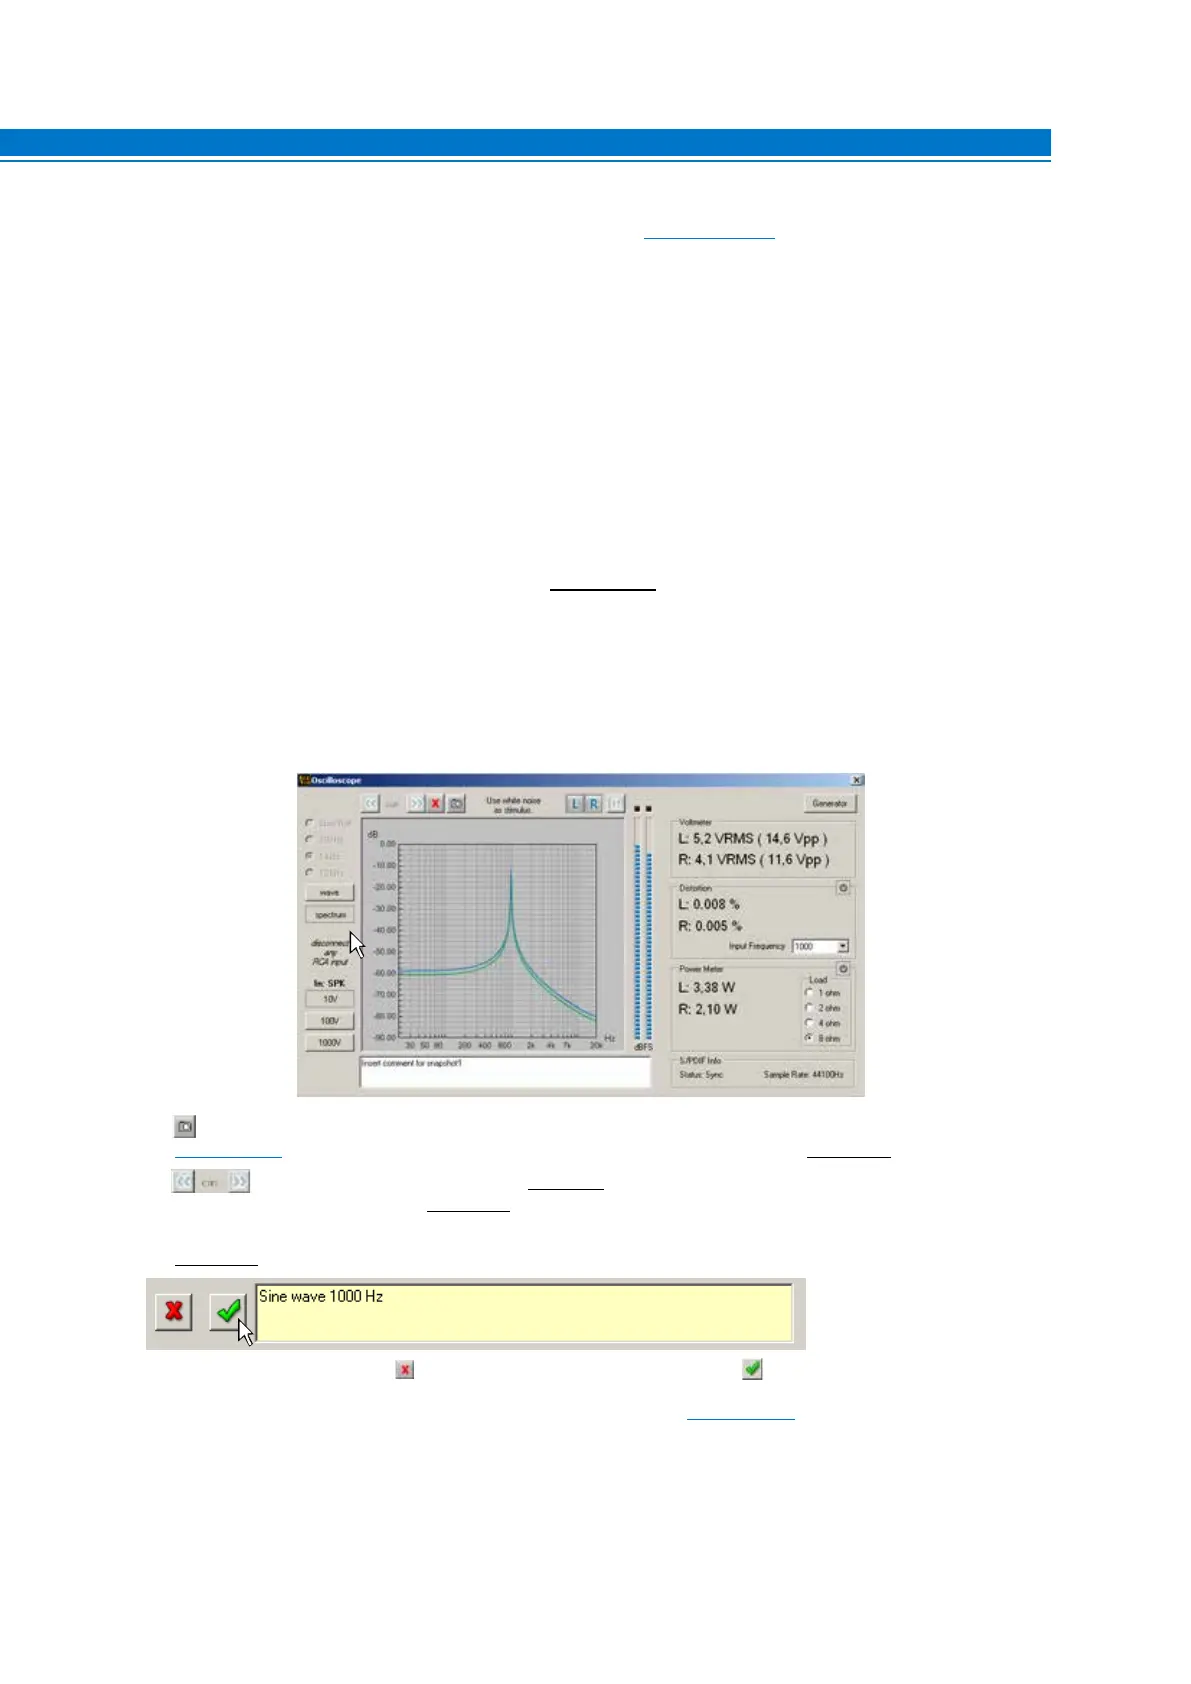
5. LEFT: activates the measurement of the signal on the LEFT input channel. The track displayed on the screen is blue.
6. RIGHT: activates the measurement of the signal on the RIGHT input channel. The track displayed on the screen
is green.
7. PAUSE: blocks the acquisition of the input signal, freezing the acquired signal on the screen.
8. SLOW ROLL: Sets the “time/div” time base for the signal acquisition to a slow pace. Acquires the signal whose
cycle is less than 5 seconds.
9 -10 -11. Depending on the frequency of the signals to be displayed, you need to set the time base to the optimal
frequency for a correct visualization.
100 Hz: 0.0025 sec/division (2.5 ms/div.)
1 KHz: 0.00025 sec/division (0.25 ms/div.)
10 KHz: 0.00025 sec/division (0.025 ms/div.)
Through the time display of the cyclic (periodic) signal, you can know its frequency:
Frequency (Hz)=
1
Period (ms)
The period is the time that the signal takes to complete a cycle. The period’s time is measured by adding the number
of divisions in a signal’s cycle.
12. WAVE: Enables the oscilloscope function.
13. SPECTRUM: Enables the spectrum analyzer function.
14. Snap acquisition: captures the image on the screen, which can be included in the measurement report
(see sect. 6.2.4.9). To save the image, enter a comment regarding the measurement (see point 16).
15. Scroll view: after selecting PAUSE
(see point 7), by selecting these buttons repeatedly, you can view the
captured images one at a time
(see point 12).
16. Snapshot Text: this box is used to enter a comment on the acquisition made by the snap acquisition function
(see point 14).
Save the comment by selecting , or delete the acquisition by selecting the button.
17. GENERATORS: activates the programmable frequency generator
(see sect. 6.2.4.3).
18. BAR GRAPH AMPLITUDE: displays, via a bar viewer, the level of the input signal. The lighting of the red LEDs
indicates full scale (over range). The bar graph scale is logarithmic.
19. VOLTMETER: Displays the voltage value (RMS) and the Peak to Peak voltage of the input channels.
6