USER’S MANUAL / bit Tune /
35
20. DISTORTION: Selecting the button activates the window that displays the distortion value (THD) expressed
as a percentage (%). The measurement can be made with 3 sinusoidal sample frequencies (Input frequency Hz)
100 Hz, 1000 Hz, 10000 Hz. The measurement can be performed using the internal generator
(see point 17) and
by setting a sinusoidal signal on one of the sample frequencies (100 Hz, 1000 Hz, 10000 Hz). You can use an
external
generator or the sinusoidal signal supplied by a CD player which is able to provide the three sinusoidal
frequencies (100 Hz, 1000 Hz, 10000 Hz).
21. POWER METER:
Selecting the button activates the window that displays the value of the Power (Watt) with a
continuous sinusoidal. The measurement can be carried out on four resistive load values. Select the value of the
resistive load (Load: 1 ohm, 2 ohm, 4 ohm, 8 ohm) on which to perform the measurement. Insert a load resistance
at the amplifier’s output with the previously selected value with a dissipation capacity in Watts proportionate to the
amplifier’s power. Connect the heads of the resistances to the SPK-IN inputs
(see sect. 3.2.5)
of the bit Tune.
22. S/PDIF Info: Displays information of the optical digital signal (S/PDIF) if an optical cable is connected to the TOS
LINK connector input (OPTICAL IN
see sect. 3.2.2
).
Status Sync: Sync. Presence of a digital signal.
Status Sync: - Absence of a digital signal.
Sample Rate: frequency of the digital signal. You can visualize frequencies up to 192 kHz.
Sample Rate: - Absence of a digital signal.
23. Screen: Shows the time progress of the signal applied to the input of the bit Tune, activating the Wave or
Spectrum function.
24. Close: Closes the oscilloscope measurement window.
Refer to
section 7.9 with measurement examples.
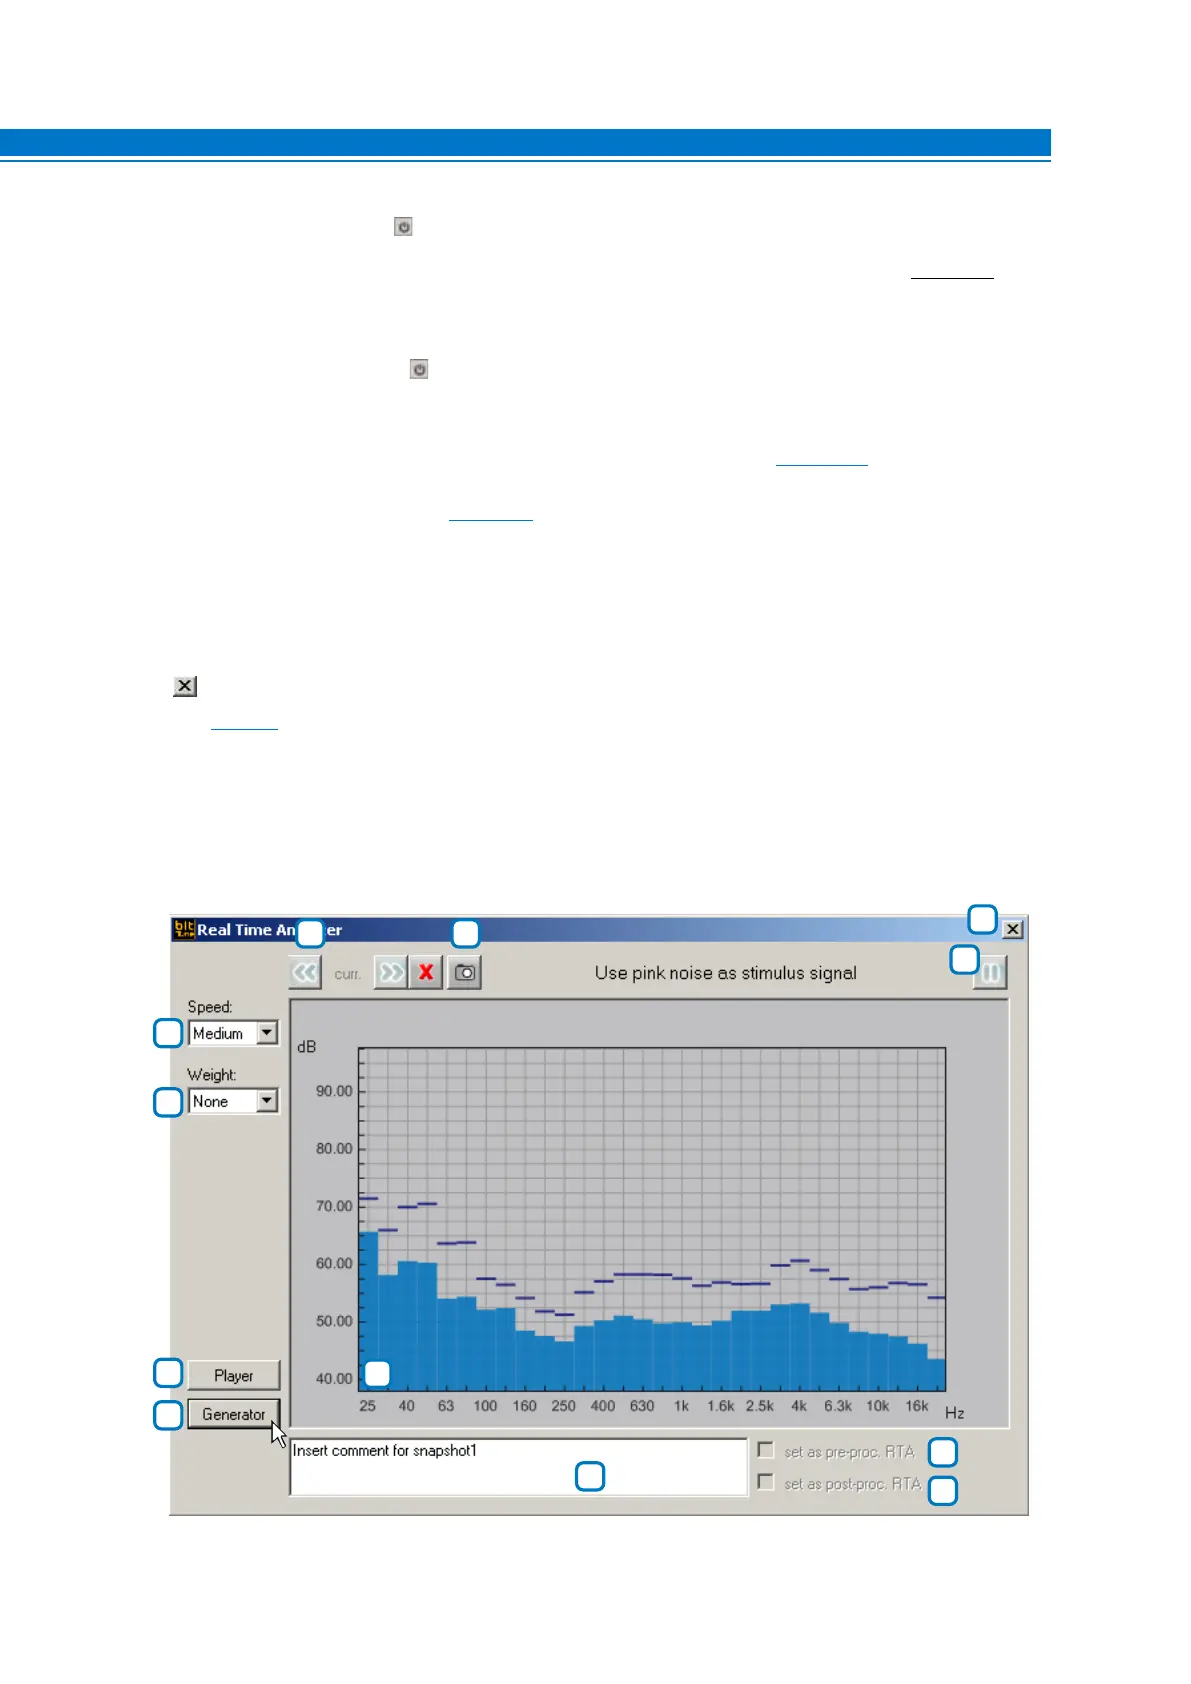
2. REAL TIME ANALYZER:
The Real Time Analyzer is an audio spectrum analyzer that uses the signal acquired from the HSM microphone
for the measurement. The frequency response is shown in a logarithmic scale with 30 bands on the horizontal
axis and a level from 40 dB> to 96 dB> on the vertical axis.
With this tool you can measure the frequency response of audio systems installed in the car.
3
4
2
1
7 6
5
12
9
10
8
11
6