USER’S MANUAL / bit Tune /
36
Description of functions:
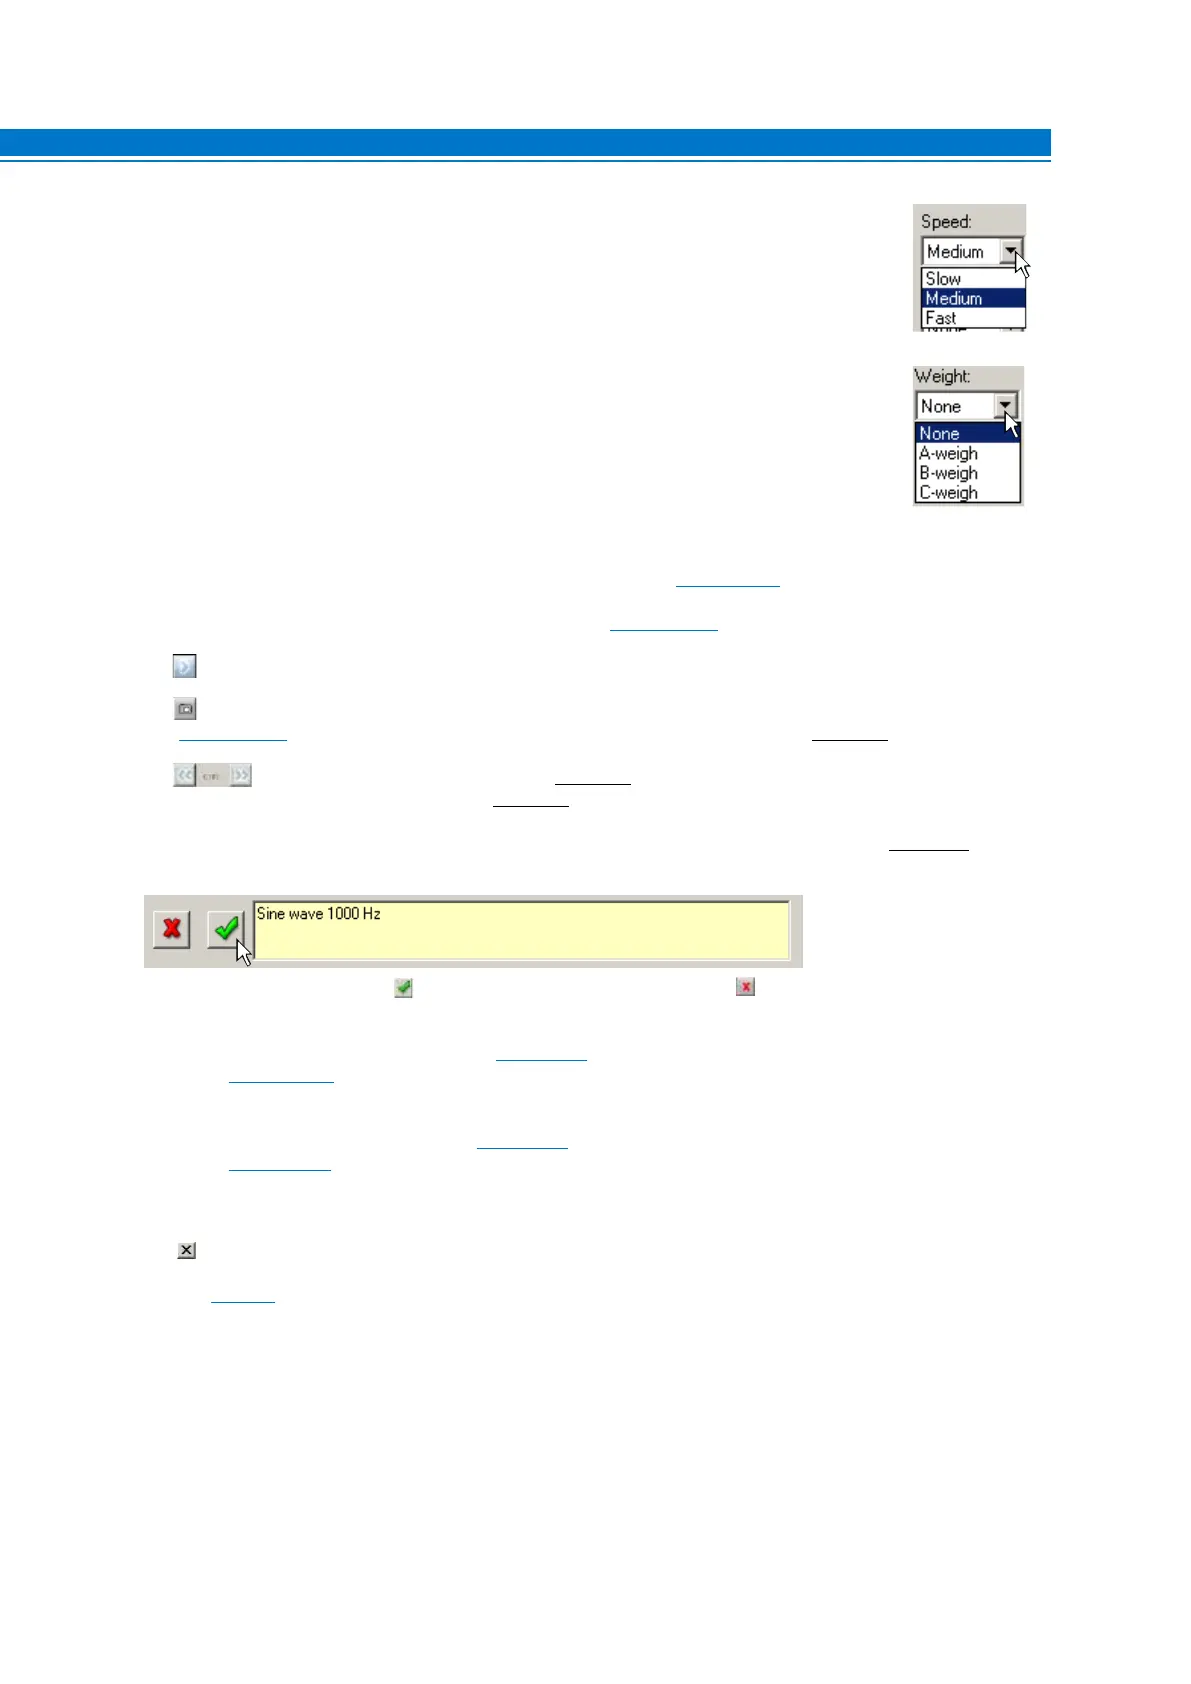
1. Speed: Sets the refresh rate of the spectral measurement displayed for a good
balance between accuracy and ease of reading.
2. Weight: Select the type of weighting filter for the measurement.
None: Excludes any weighting filter in the signal acquisition. Expresses the absolute
value but does not take into account the acoustic perception of the human ear.
A-weight: Suggested. Enables a type A weighting filter. Inserts a filter that simulates the
perception of the human ear with a low background noise.
It is the curve used for signal to noise ratio(S/N ratio) measurements.
B-weight: Enables a type B weighting filter. It is used with medium level background noise.
C-weight: Enables a type C weighting filter. It is used with high level background noise.
3. GENERATORS:
Activates the programmable frequency generator (see sect. 6.2.4.3), to generate measurement signals.
4. PLAYER: Activates the player for audio tracks playback (see sect. 6.2.4.4).
5. PAUSE/PLAY: Blocks the acquisition of the input signal, freezing the acquired signal on the screen.
6. Snap acquisition: Captures the picture on the screen that can be included in the measurement report
(see sect. 6.2.4.9). To save the image, enter a comment regarding the measurement (see point 8).
7. SCROLL VIEW: After selecting PAUSE
(see point 5), by selecting these buttons repeatedly you can
view the captured images one at a time
(see point 8).
8. Snapshot Text: Enter a comment on the acquisition made by the snap acquisition function
(see point 6).
Save the comment by selecting ,or delete the acquisition by selecting the button.
9. Set as pre-proc. RTA:
The box is active when selecting the Snapshot Text. Its function is to store an RTA curve
acquired prior to the Processor Auto Setup
(see sect. 6.2.6). The image of the graph(Snapshot) will be shown on the
Report
(see sect. 6.2.4.9).
10. Set as post-proc RTA:
The box is active when selecting the Snapshot Text. Its function is to store an RTA curve
acquired after the Processor Auto Setup
(see sect. 6.2.6). The image of the graph (Snapshot) will be shown on the
Report
(see sect. 6.2.4.9).
11. Screen:
Displays the progress of the signal according to the frequency applied to the input of the bit Tune.
12. Close:
Closes the measurement window of the Real Time Analyzer.
Refer to
section 7.7
with measurement examples.
6