A-22
Appendix A Maintenance and Troubleshooting of this Device
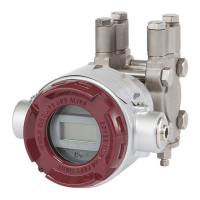
Index value Index value
Maximum value
under normal
operating conditions
Minimum value
under normal
operating conditions
Maximum value
under simulated
clogging
Minimum value
under simulated
clogging
Maximum value
under normal
operating conditions
Minimum value
under normal
operating conditions
Maximum value
under simulated
clogging
Minimum value
under simulated
clogging
Normal condition Simulated clogging
Normal condition Simulated clogging
condition
Slight dierence Value being overlapping
In this case, it is necessary to examine the cause of the large variation that occurs under normal
conditions, and to reduce this effect. Use the following the guidelines for adjustment.
Guidelines for parameter adjustment
Phenomenon Adjustment
The index value sometimes decreases
significantly under normal operating conditions.
At this time, the process variable changes or the
standard deviation becomes large.
Decrease the Press Freq Filter Constant in
steps of 0.02–0.05.
The index value under normal operating
conditions changes significantly depending on
the operating conditions.
Check whether the operating conditions are
related to the process variable. If there is a
PV range where the difference between the
maximum index value and the minimum
is relatively small, or a PV range where the
minimum under normal conditions is not
small, set Press Freq Calc PV High Limit and
Press Freq Calc PV Low Limit to the values of
this range.
When these parameters are used, diagnosis
should be carried out only when there is a
flow, and should be stopped when the flow is
stopped. By doing so, diagnosis can be done
reliably even if the fluid flow is intermittent.
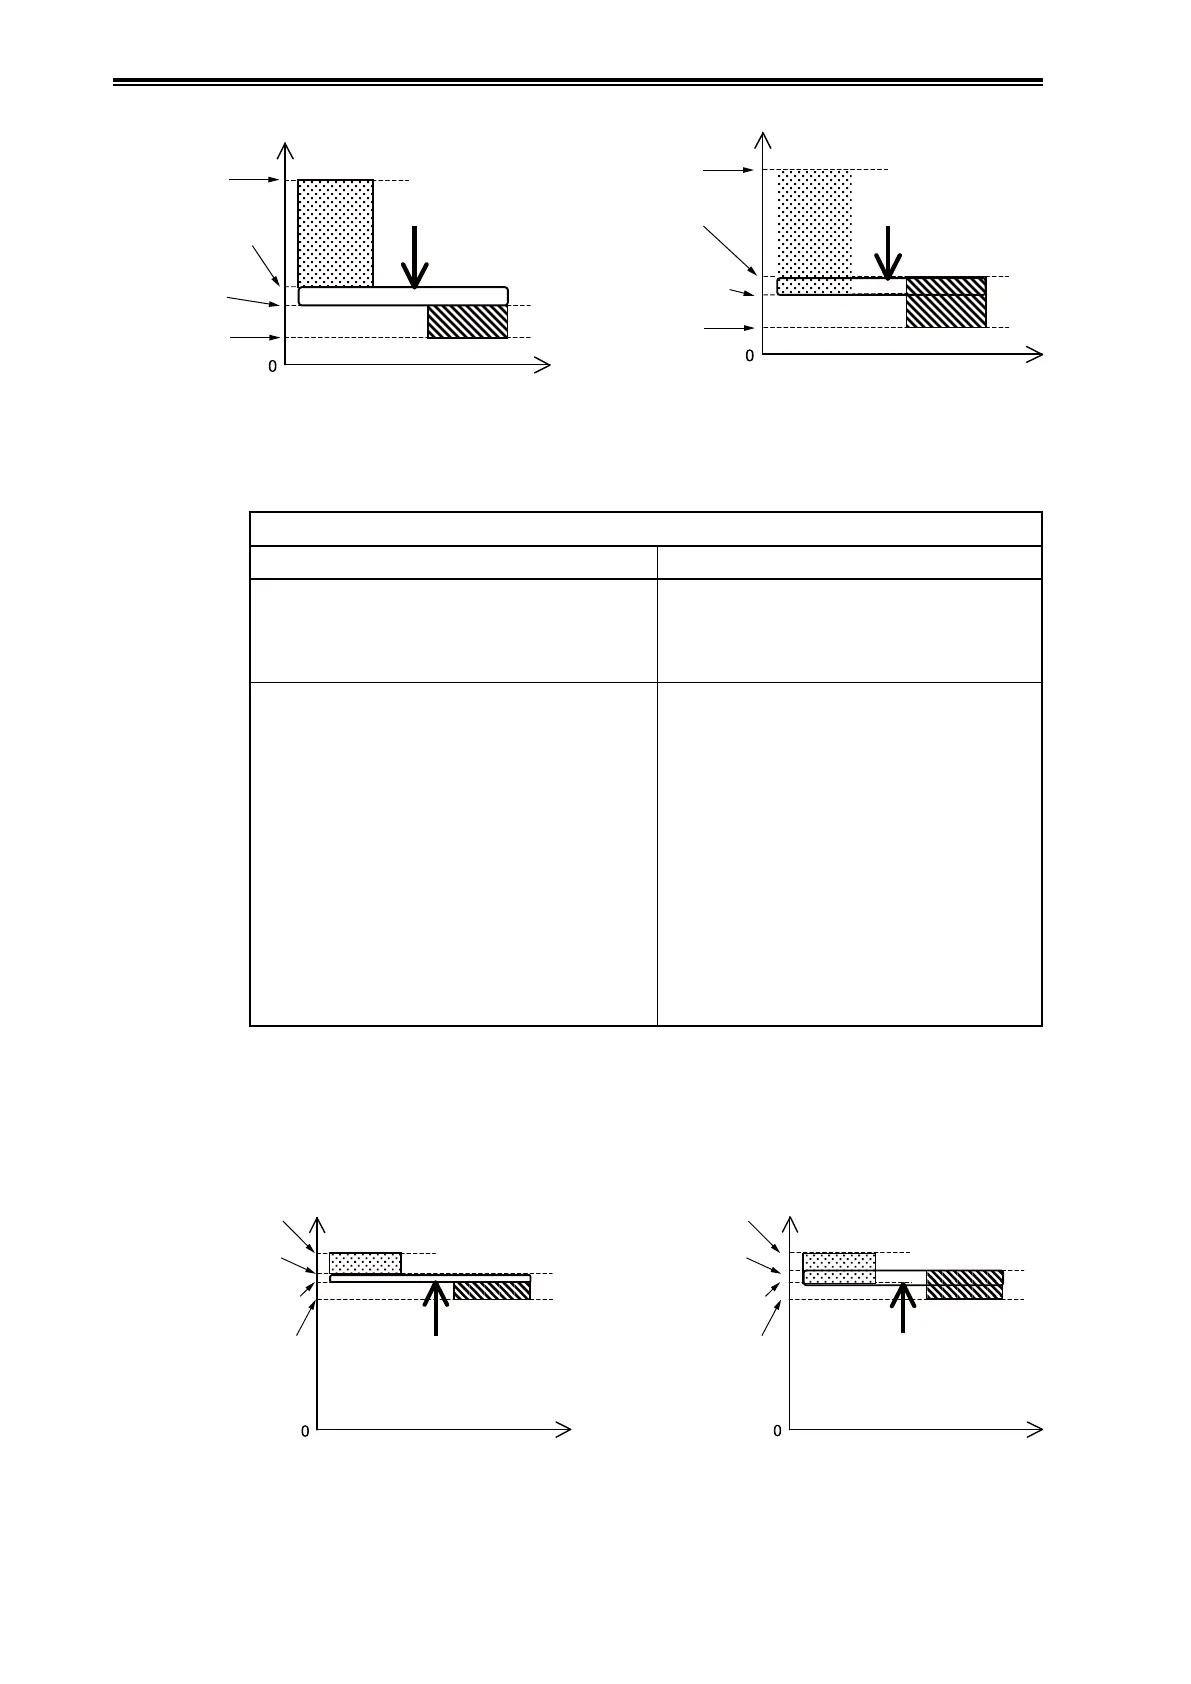
(B) The variation of the index when there is a clog is small.
In this case, although variation in the index is relatively small under normal operating conditions,
the value of the index is almost the same as with simulated clogging, as shown in the figure below.
Index value Index value
Maximum value under normal
operating conditions
Minimum value under normal
operating conditions
Maximum value under simulated
clogging
Minimum value under simulated
clogging
The dierence with that of
the clog simulated condition is small
Cannot make a distinction
as values are overlapped
Normal condition Simulated clogging
Maximum value under normal
operating conditions
Minimum value under normal
operating conditions
Maximum value under simulated
clogging
Minimum value under simulated
clogging
Normal condition Simulated clogging