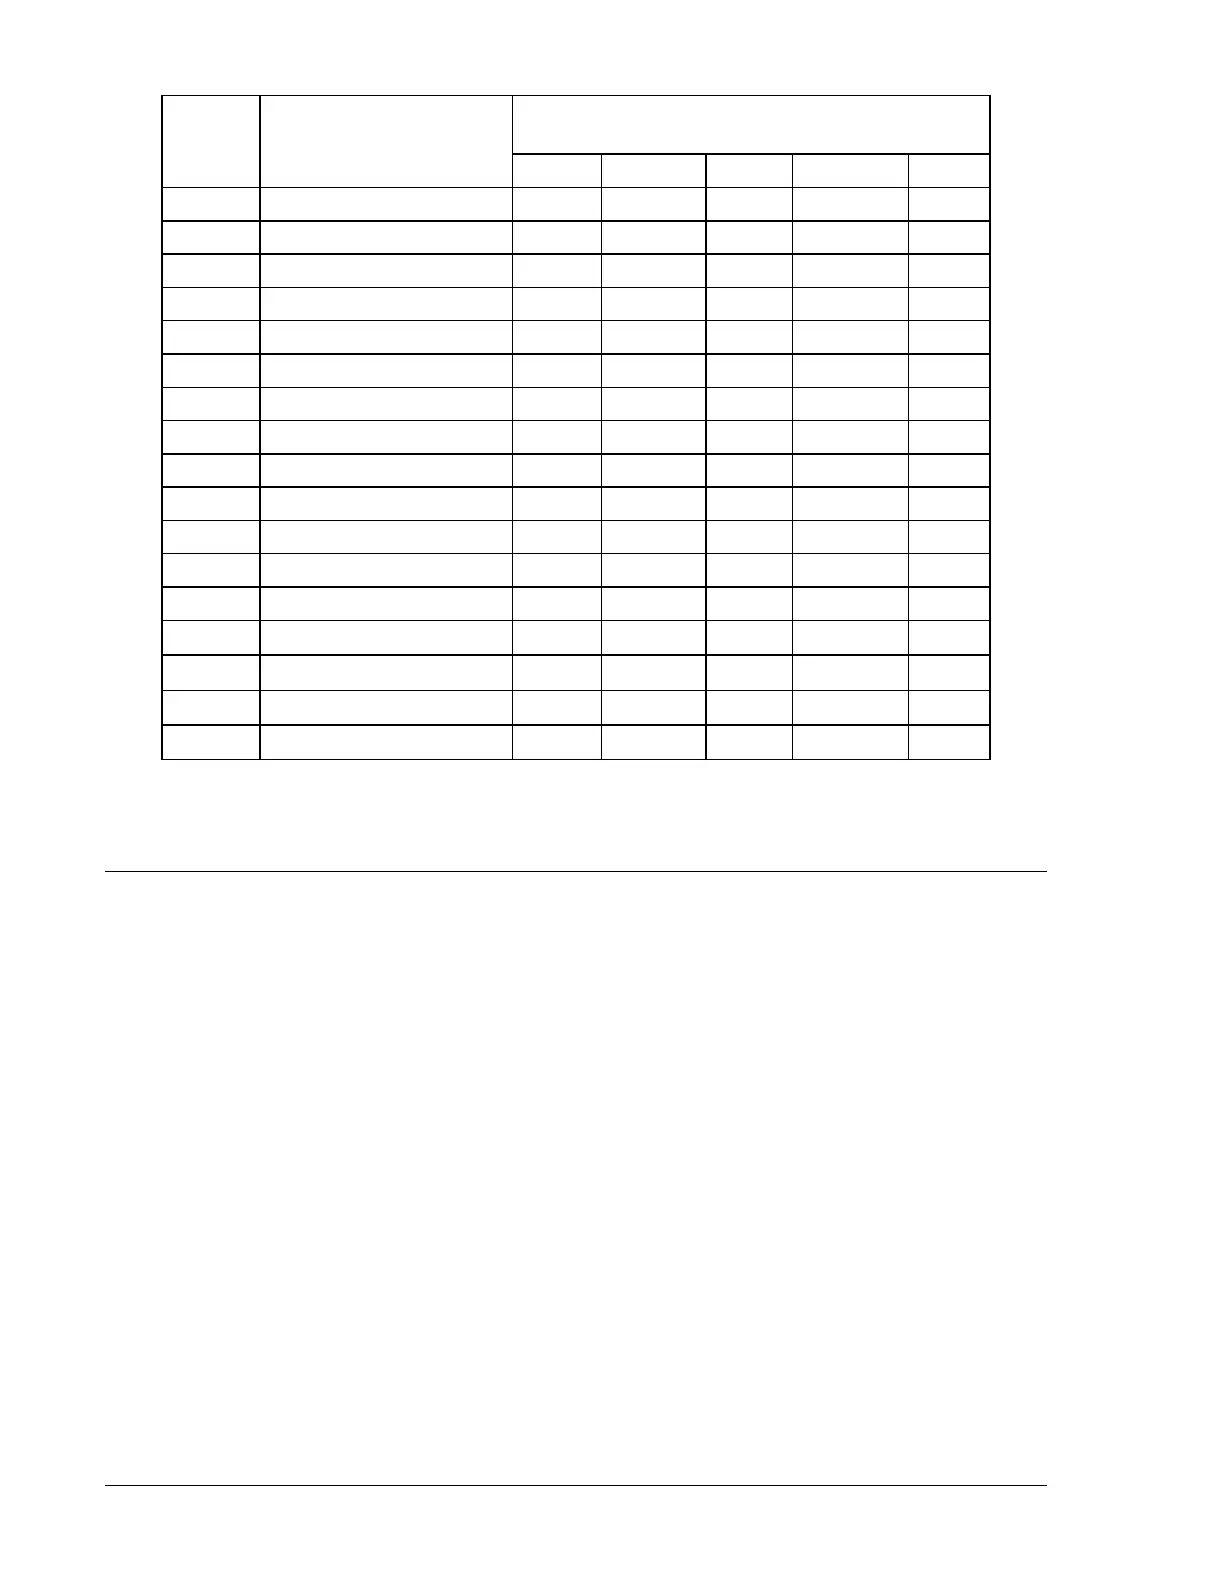
Table A-1. Time Characteristic Curve Constants
Curve
Selection
Curve Name
Trip Characteristic Constants
A B C N K
S1
S, S1, Short Inverse 0.2663 0.03393 1.0000 1.2969 0.0280
S2, Short Inverse 0.0286 0.02080 1.0000 0.9844 0.0280
L1
L, L1, Long Inverse 5.6143 2.18592 1.0000 1.0000 0.0280
L2, Long Inverse 2.3955 0.00000 1.0000 0.3125 0.0280
D
D, Definite Time 0.4797 0.21359 1.0000 1.5625 0.0280
M
M, Moderately Inverse 0.3022 0.12840 1.0000 0.5000 0.0280
I, I1, Inverse Time 8.9341 0.17966 1.0000 2.0938 0.0280
I2
I2, Inverse Time 0.2747 0.10426 1.0000 0.4375 0.0280
V1
V, V1, Very Inverse 5.4678 0.10814 1.0000 2.0469 0.0280
V2, Very Inverse 4.4309 0.09910 1.0000 1.9531 0.0280
E1
E, E1Extremely Inverse 7.7624 0.02758 1.0000 2.0938 0.0280
E2
E2, Extremely Inverse 4.9883 0.01290 1.0000 2.0469 0.0280
A, Standard Inverse 0.01414 0.00000 1.0000 0.0200 0.0280
B
B, Very Inverse (I
2
t)
1.4636 0.00000 1.0000 1.0469 0.0280
C
C, Extremely Inverse (I
2
t)
8.2506 0.00000 1.0000 2.0469 0.0280
G
G, Long Time Inverse (I
2
t)
12.1212 0.00000 1.0000 1.0000 0.0280
F
Fixed Time ∗
0.0000 1.00000 0.0000 0.0000 0.0280
∗ Curve F has a fixed delay of one second times the Time Dial setting.
TIME OVERCURRENT CHARACTERISTIC CURVE GRAPHS
Figures A-1 through A-16 illustrate the characteristic curves of the DGC-500. Table A-2 cross-references
each curve to existing electromechanical relay characteristics. Equivalent time dial settings were
calculated at a value of five times pickup.
A-2 DGC-500 Time Overcurrent Characteristic Curves 9355400990 Rev H