Biotage
®
Selekt User Manual | © Biotage 2020
Results
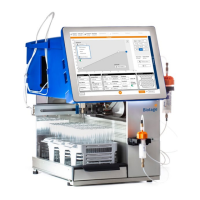
Figure 37. The rack filter in the Results view. The selected rack (in
position B) has fractions from two different runs, i.e. two reports are
listed. As two racks were used in the selected run, the selected rack is
highlighted in the report. (The example shows a system with an extended
collection bed and rack sharing enabled.)
Analysis of the Result
Analyze the result by selecting the report in the Results view
and pressing Analysis.
Find Fractions
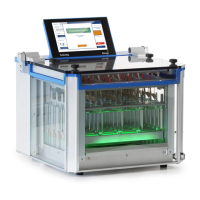
In the default Analysis view, the chromatogram and rack(s) are
shown (see Figure 38). The chromatogram can be zoomed using
the pinch-to-zoom feature, and the signals and UV baseline
correction (if used) can be disabled and enabled individually
by pressing Options.
Use this view to find your fractions.
Fractions can be located by matching their colors and numbers
in the chromatogram with the vessel colors and numbers in
the rack(s). Fractions from the same peak have the same color.
Fractions only collected due to the Collect All option are gray.
Figure 38. The Analysis view showing the chromatogram and the rack(s).
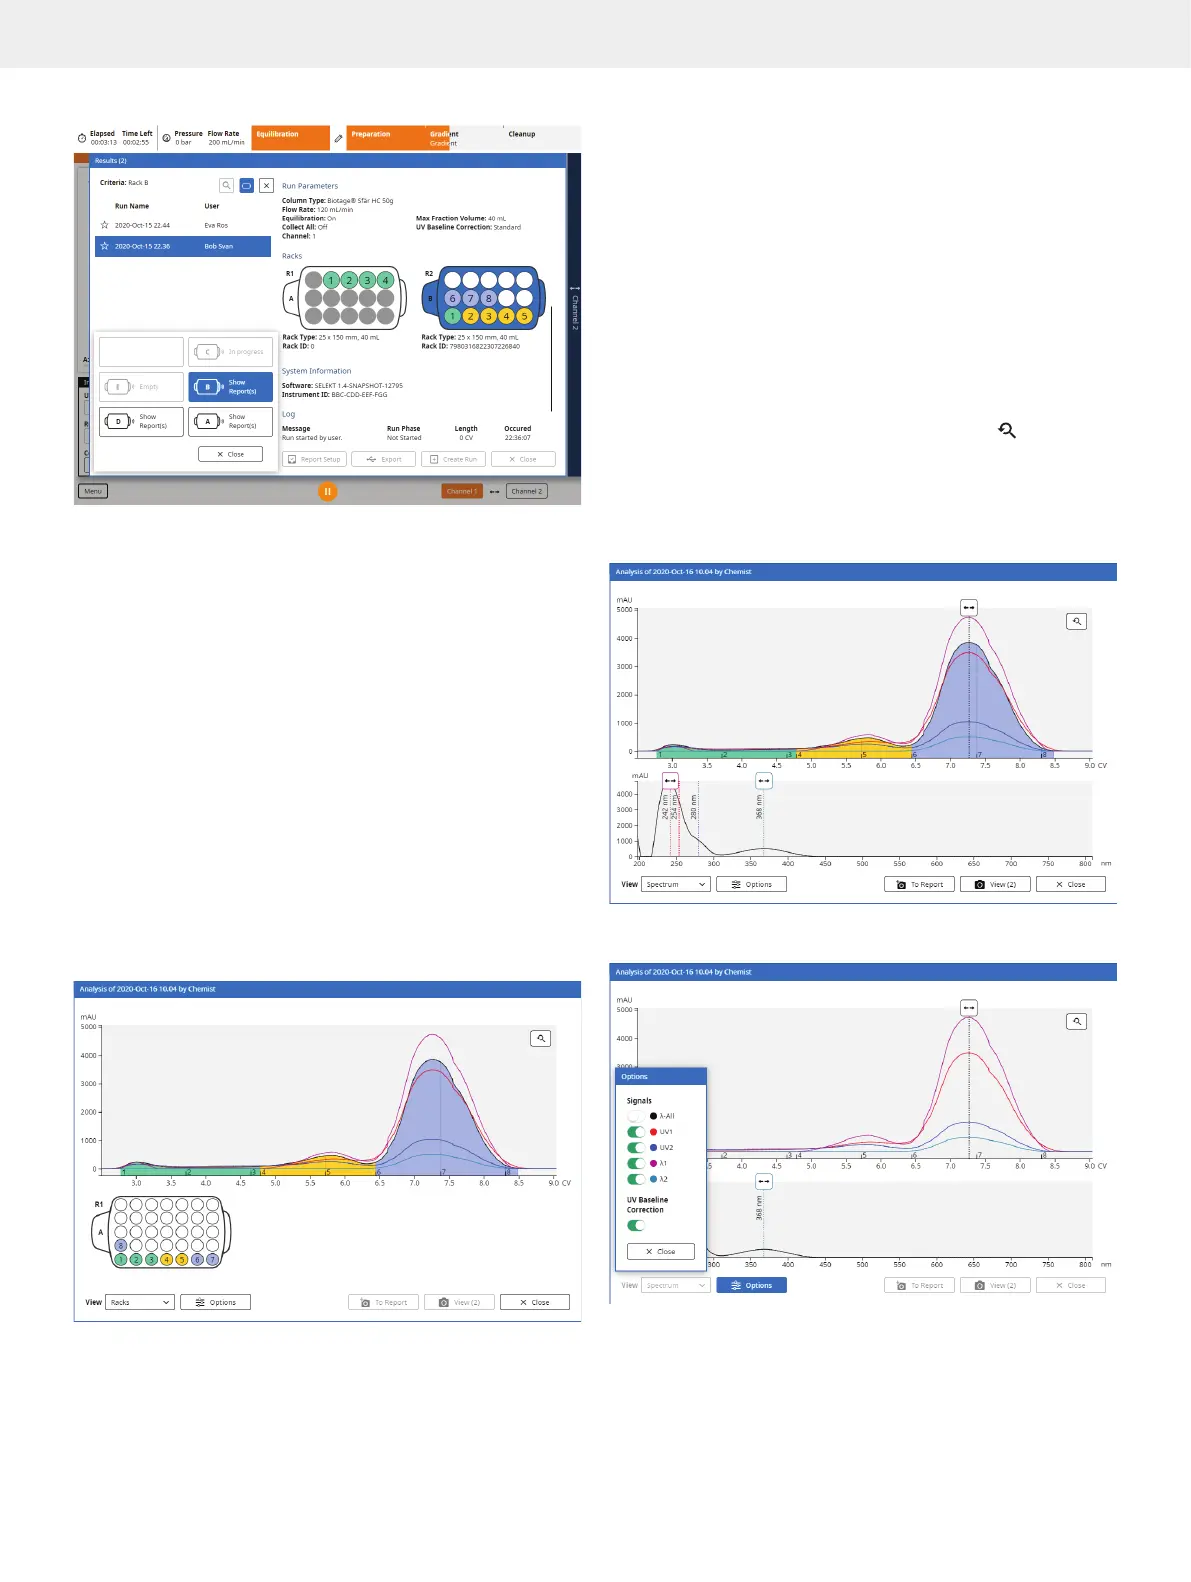
Analyze the Spectrum
If a Spektra software license is installed, it is possible to switch
from viewing the rack(s) to viewing an absorbance spectrum by
selecting Spectrum from the View drop-down list (see Figure 39).
In this view, you can:
»
Drag the line in the chromatogram to the position/time
for which you want see the absorbance spectrum.
»
Drag the λ1 and λ2 lines to the desired wavelengths
in the spectrum. The curves for the extra wavelengths
will be added to the chromatogram.
»
Zoom the chromatogram using the pinch-to-zoom feature.
It is possible to zoom in one direction (X or Y) or both
directions (X and Y). To reset the zoom, press
.
»
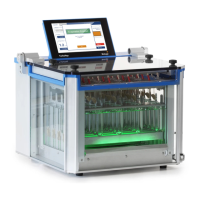
Enable and disable signals and the UV baseline correction
(if used) individually by pressing Options; see Figure 40.
Note: Toggling the UV Baseline Correction option only
affects the spectrum and the λ1 and λ2 signals.
Figure 39. The Analysis view showing the chromatogram and the
absorbance spectrum. Requires a Spektra software license.
Figure 40
. The Options dialog.