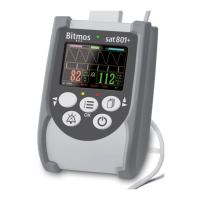
sat801+ Pulse Oximeter
Data
62
The device records the oxygen saturation and pulse rate data every second continuously. In the
Trend display, this can be shown as a trace (SpO
2
or pulse) or both simultaneously over different
time as (24, 16, 12, 8, 4, 2 hours; 60, 20, 8, 4 minutes)
9.2.1 Trend display
1. Starting from the main menu, call:
Data Trend
2. select the time scale (4 minutes till
24 hours)
3. select the display mode (SpO2,
pulse or both)
The most recent data are displayed
in the required format.
4. Press to move the pointer to
later times and to move to
earlier times.
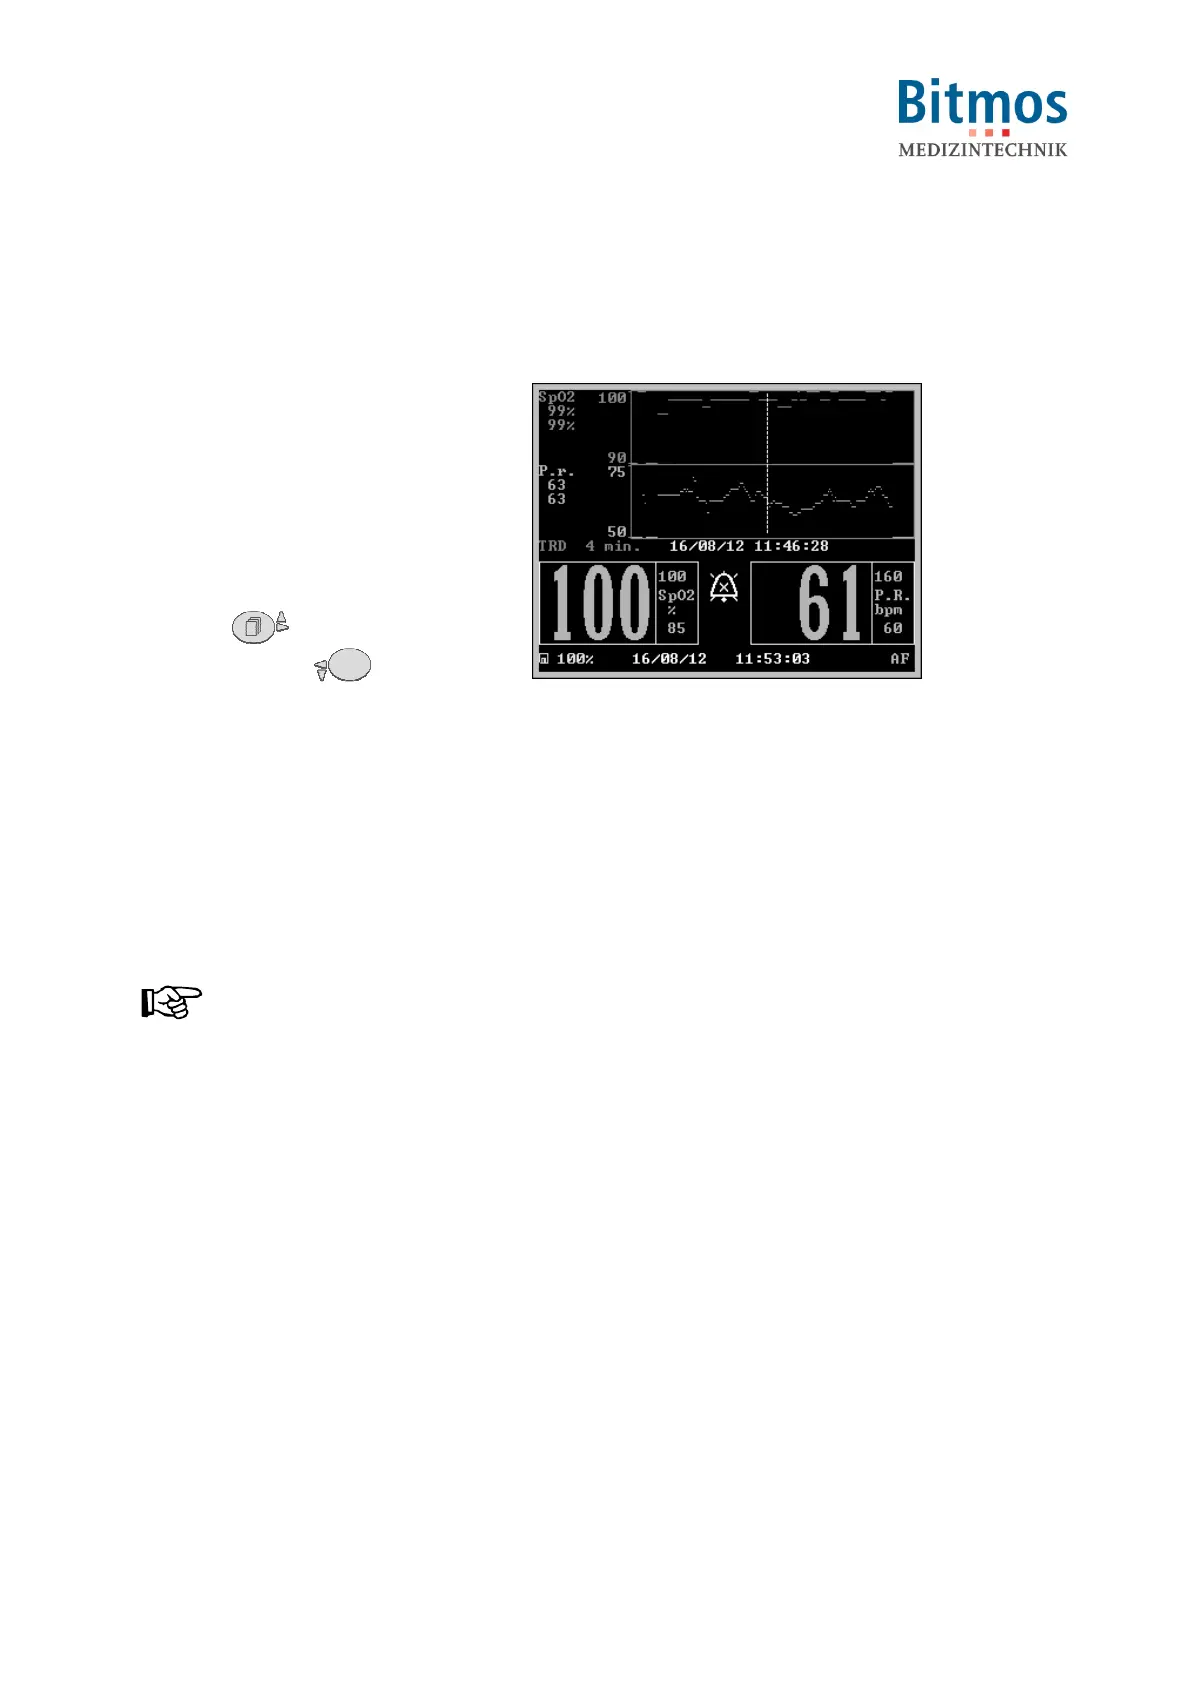
Fig. 60: Trend display
At the current position (the position of the screen marker) are displayed:
Left:
• minimum (lower value) and maximum (upper value) at that point in time. "---" is displayed
if there are no values available)
Lower Line
• selected display mode
• time scale (4 minutes till 24 hours)
• Date (here: 16/08/12) and time (here: 11:46:28)
NOTICE!
When the marker reaches the left or right hand edge of the display, the area shown is
moved by half a screen to one side.
The screen marker cannot move beyond the start or the end of the data.
5. For leaving the trend display, press ok.