sat801+ Pulse Oximeter
Advanced information
71
13 Advanced information
13.1 Averaging time
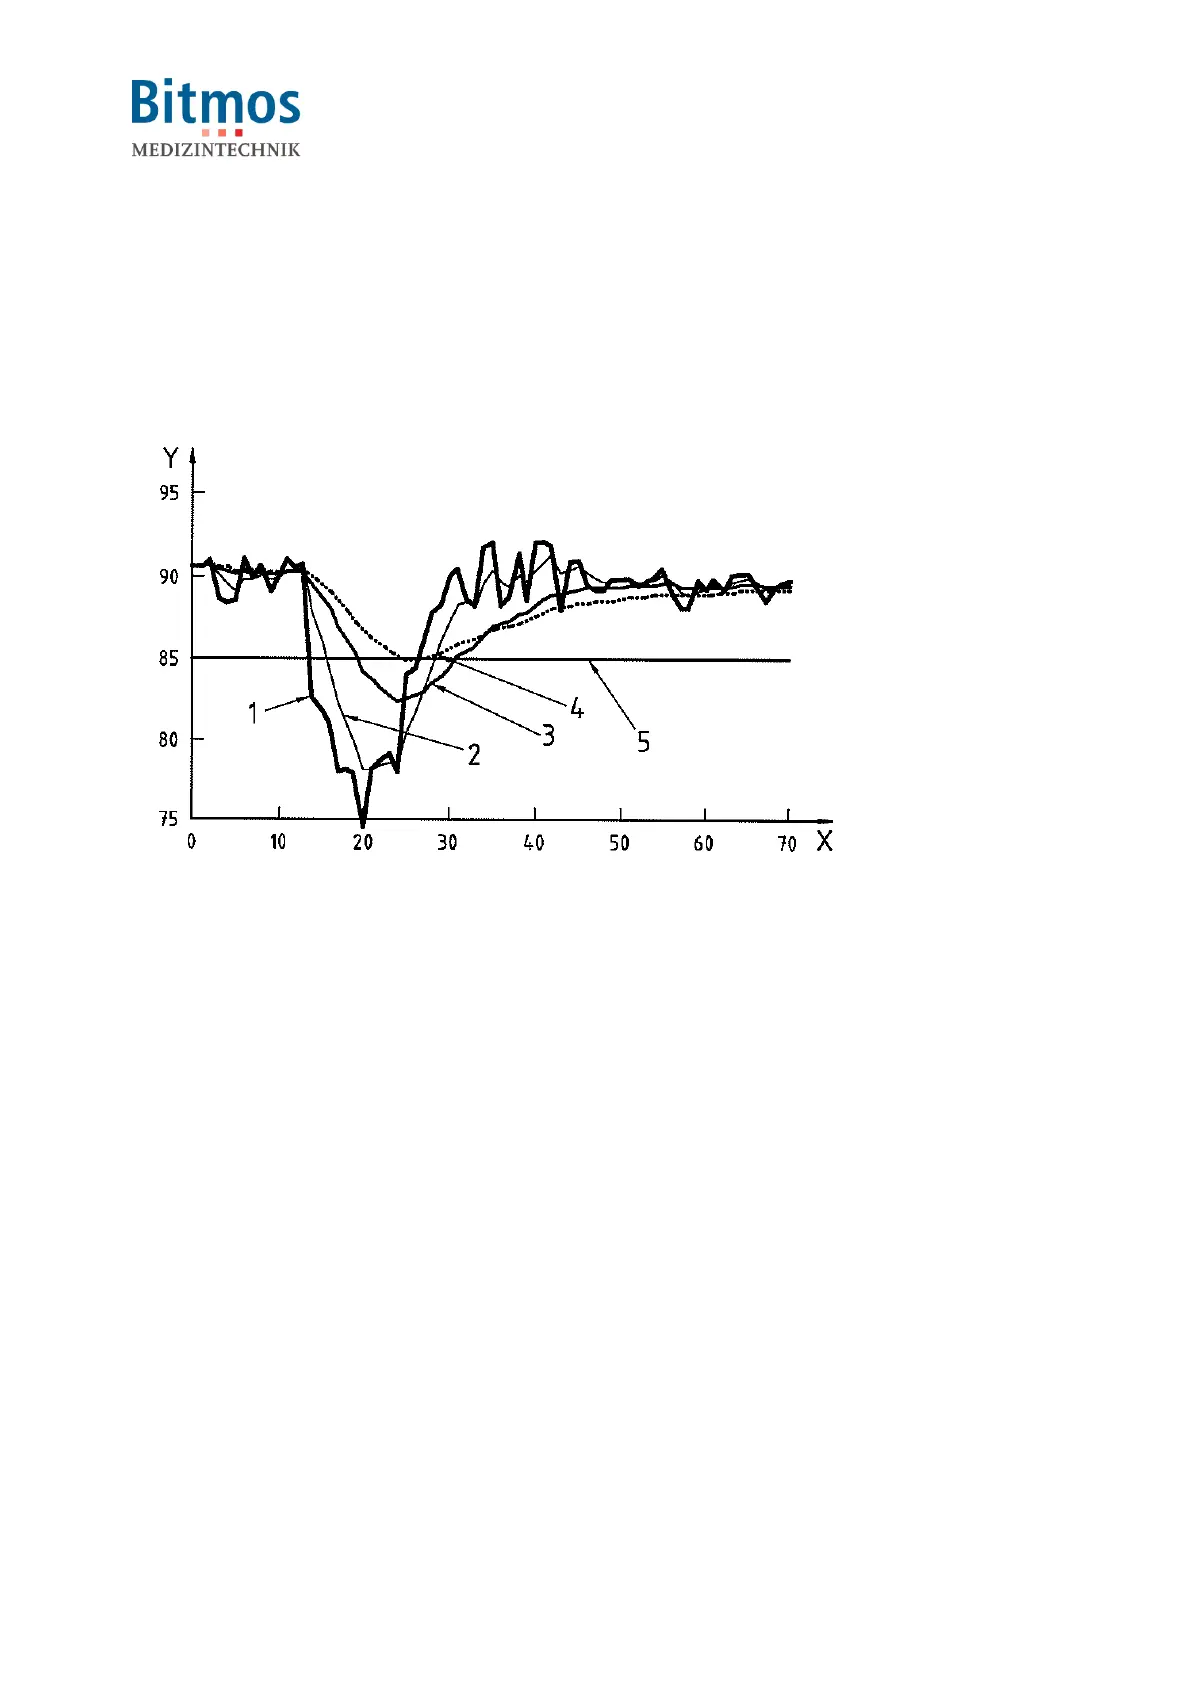
This figure represents a faster desaturation slope and a more realistic, noisier saturation signal
curve 1). Curves 3 and 4 underestimate the depth of the fall in saturation. Curve 2, faster
averaging, can cross a low saturation alarm limit sooner than curve 3, normal averaging, or curve
4, slower averaging, which might not cause an alarm condition at all. The benefit of normal and
slower averaging is to smooth out the otherwise noisy signal and reduce the number of false
positive alarm conditions.