Editing Images
2-9
2
Performing Detailed Edits in the Edit Window
2
Adjust the tone curve.
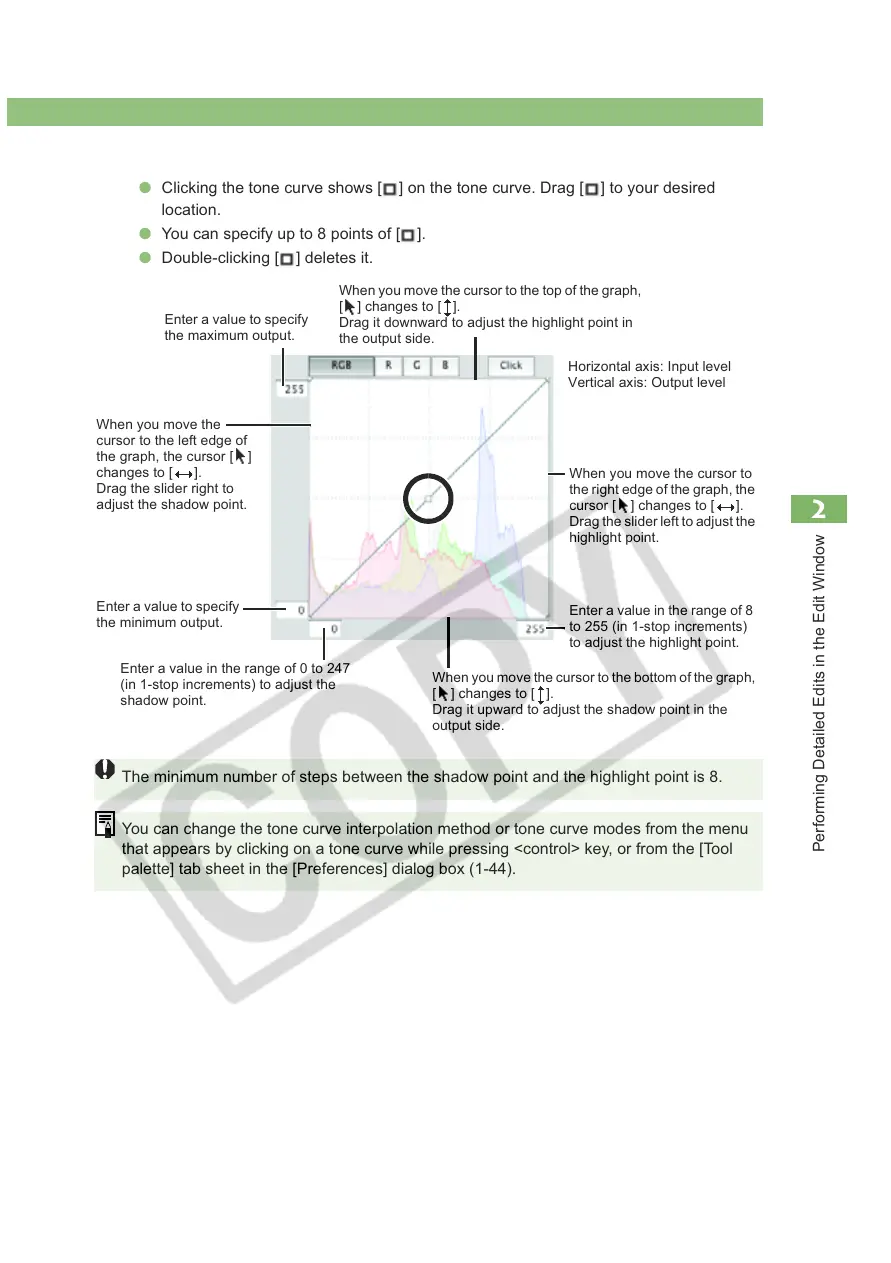
O Clicking the tone curve shows [ ] on the tone curve. Drag [ ] to your desired
location.
O You can specify up to 8 points of [ ].
O Double-clicking [ ] deletes it.
The minimum number of steps between the shadow point and the highlight point is 8.
You can change the tone curve interpolation method or tone curve modes from the menu
that appears by clicking on a tone curve while pressing <control> key, or from the [Tool
palette] tab sheet in the [Preferences] dialog box (1-44).
Enter a value to specify
the maximum output.
Enter a value to specify
the minimum output.
Enter a value in the range of 0 to 247
(in 1-stop increments) to adjust the
shadow point.
When you move the
cursor to the left edge of
the graph, the cursor [ ]
changes to [ ].
Drag the slider right to
adjust the shadow point.
When you move the cursor to
the right edge of the graph, the
cursor [ ] changes to [ ].
Drag the slider left to adjust the
highlight point.
Enter a value in the range of 8
to 255 (in 1-stop increments)
to adjust the highlight point.
Horizontal axis: Input level
Vertical axis: Output level
When you move the cursor to the top of the graph,
[ ] changes to [ ].
Drag it downward to adjust the highlight point in
the output side.
When you move the cursor to the bottom of the graph,
[ ] changes to [ ].
Drag it upward to adjust the shadow point in the
output side.