17
GRAPH- Application overview:
Menu
The Graphic application is for the graphical representation of functions and
their investigation. It has two main windows: the Graphic editor to enter the
function terms, and the Graphic window to show graphs of functions.
In the Graphic editor, up to 20 terms can be entered
(
Y1-Y20
)
Entering Function Terms
Function terms are entered with the help of the Variable- button
[
X, Ø, T
]
. Entries are confirmed with
[
EXE
]
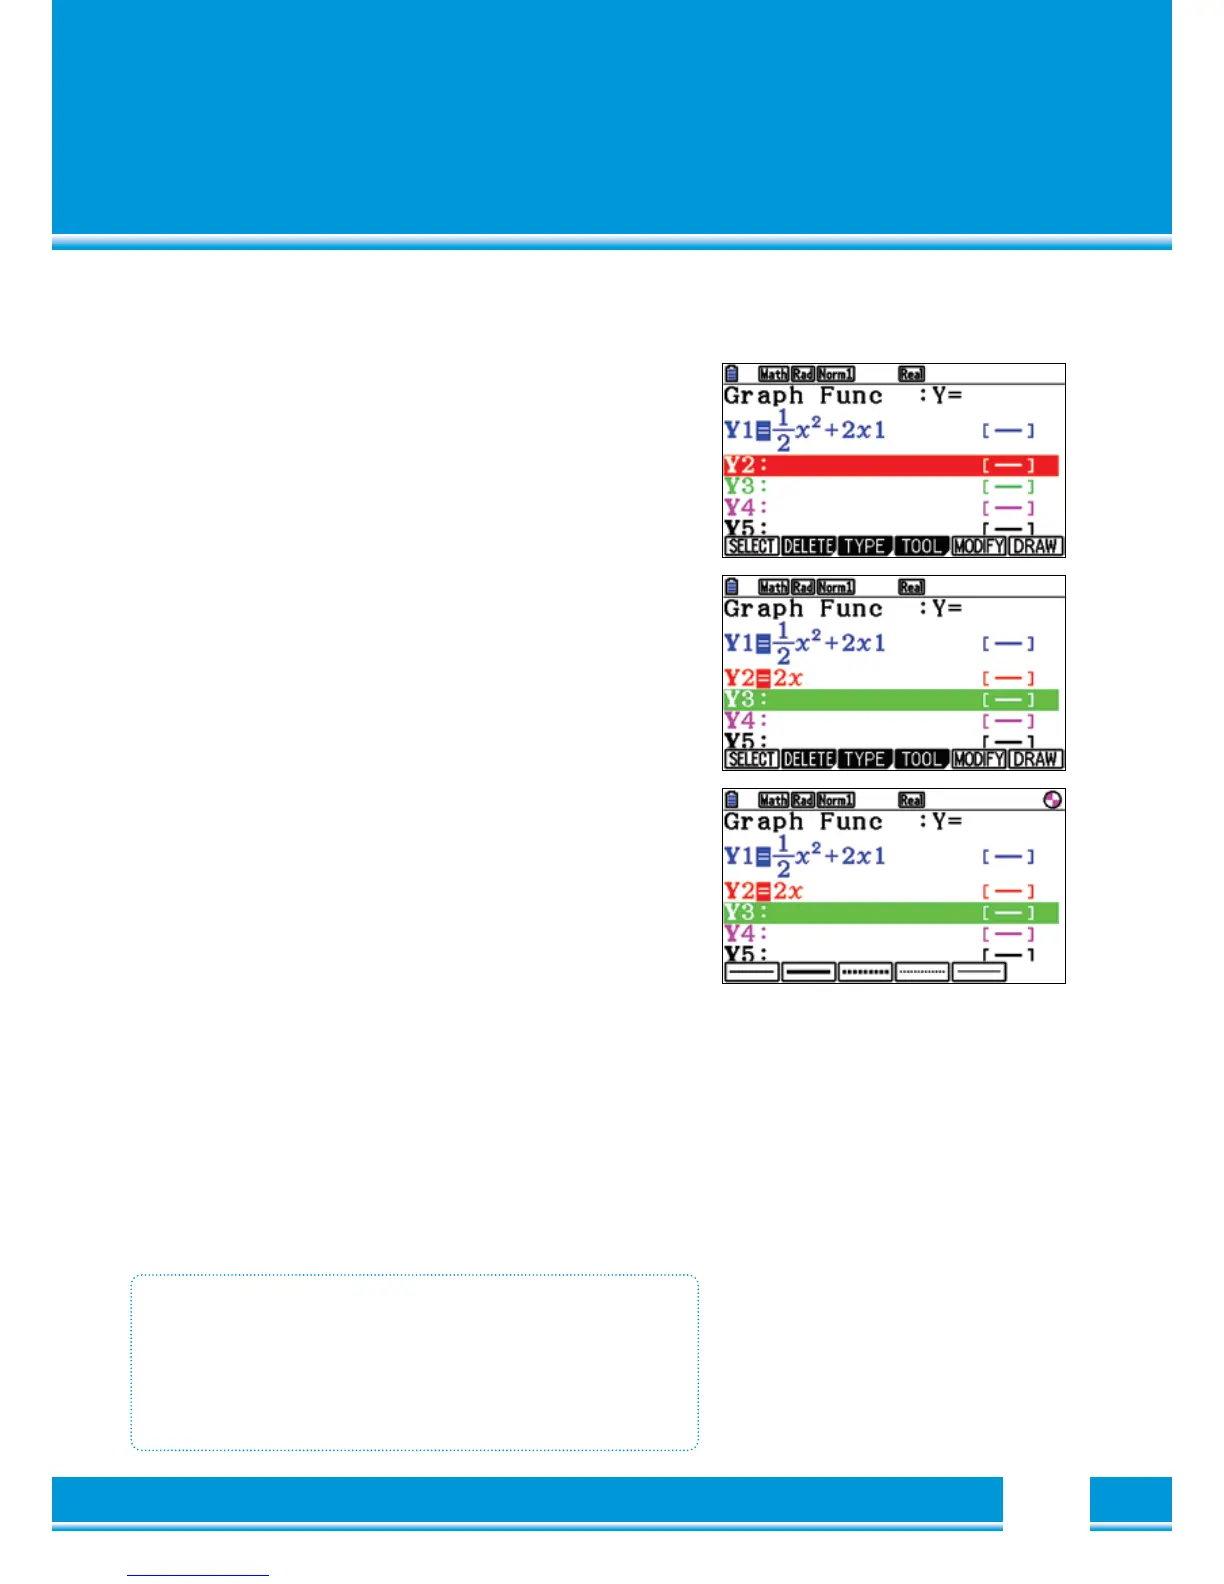
Menu of the Graphics Editor
SELECT
[
F1
]
:
For the Graphic, the displayed function term must be selected.
The selection is stored in the deposited black equal sign.
DELETE
[
F2
]
:
Deletes the Function terms.
TYPE
[
F3
]
:
Select the Function types, e.g.
Equation Y1=
([
F1
])
Parametric Function Parm
([
F3
])
Inequality >
([
F6
])
TOOL
[
F4
]
:
e.g. Select the line style: Points, lines, etc.
MODIFY
[
F5
]
:
Direct modification from Parameters in the Graphic view.
DRAW
[
F6
]
:
Show selected Terms
(
SEL
)
Graphic Application – OVERVIEW
•
Enter terms in the Graphics editor- up to 20 functions.
• Represent the functions graph in the graphics window:
Select the function term and draw the graphical
representation with
[
F6
]
(
DRAW
)