Curves
With the representation of curves, the influence of parameters are
explained in a function.
In the DYNA- application, families of curves can be dynamically
represented
(
see page 32.
)
Curves
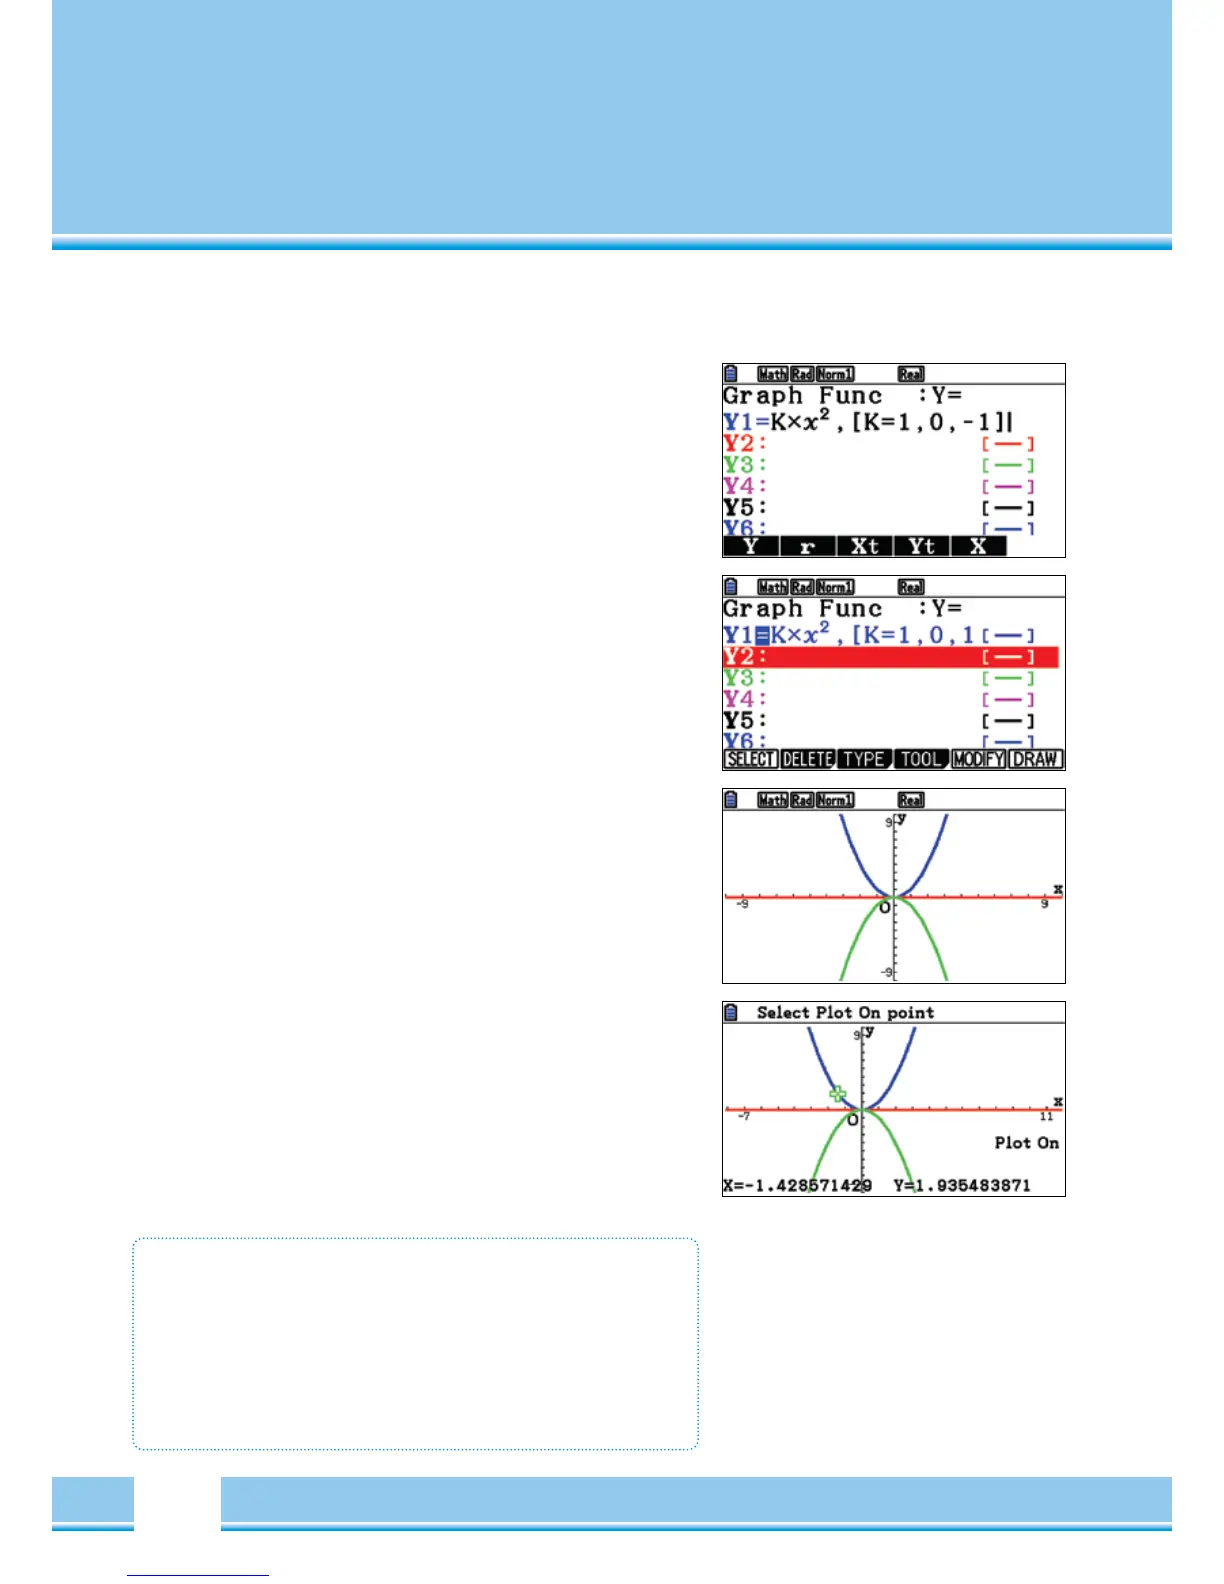
Should be shown, for example, the function with Parameter K:
f
(
x
)
= Kx^2 with K{-1,0,5,0,5,1}
Input Syntax:
Functions term,
[
Parameter= value, value,..., value
]
Note: It is also possible to enter a list with braces directly as a factor.
{Valu, Value, Value, ...} Functions term.
Graphical representation
Represent the Graph with
[
F6
]
The calculation can take a number
of little value.
Analyse the Graph
For analysis
(
TRACE, G-SOLV,...
)
the graph of the function
is selected with the Cursor keys
(
^
)
(
down
)
.
Curves
• Use a constant
(
all letters except T
)
• Specify the range of values of the constants:
e.g. K*K^2,
[
K=-1,-0.5,0.5,1
]
• Alternatively, the constant can be directly entered:
e.g. {1,2,3}*X^2