STAT- Statistics application
In the Statistics application, Data in lists can be entered and
(
graphically
)
evaluated. A description of the columns is possible.
Example: a Transcript of class work
Note
(
Feature
)
1 2 3 4 5 6
Number
(
Expression
)
3 5 9 8 4 1
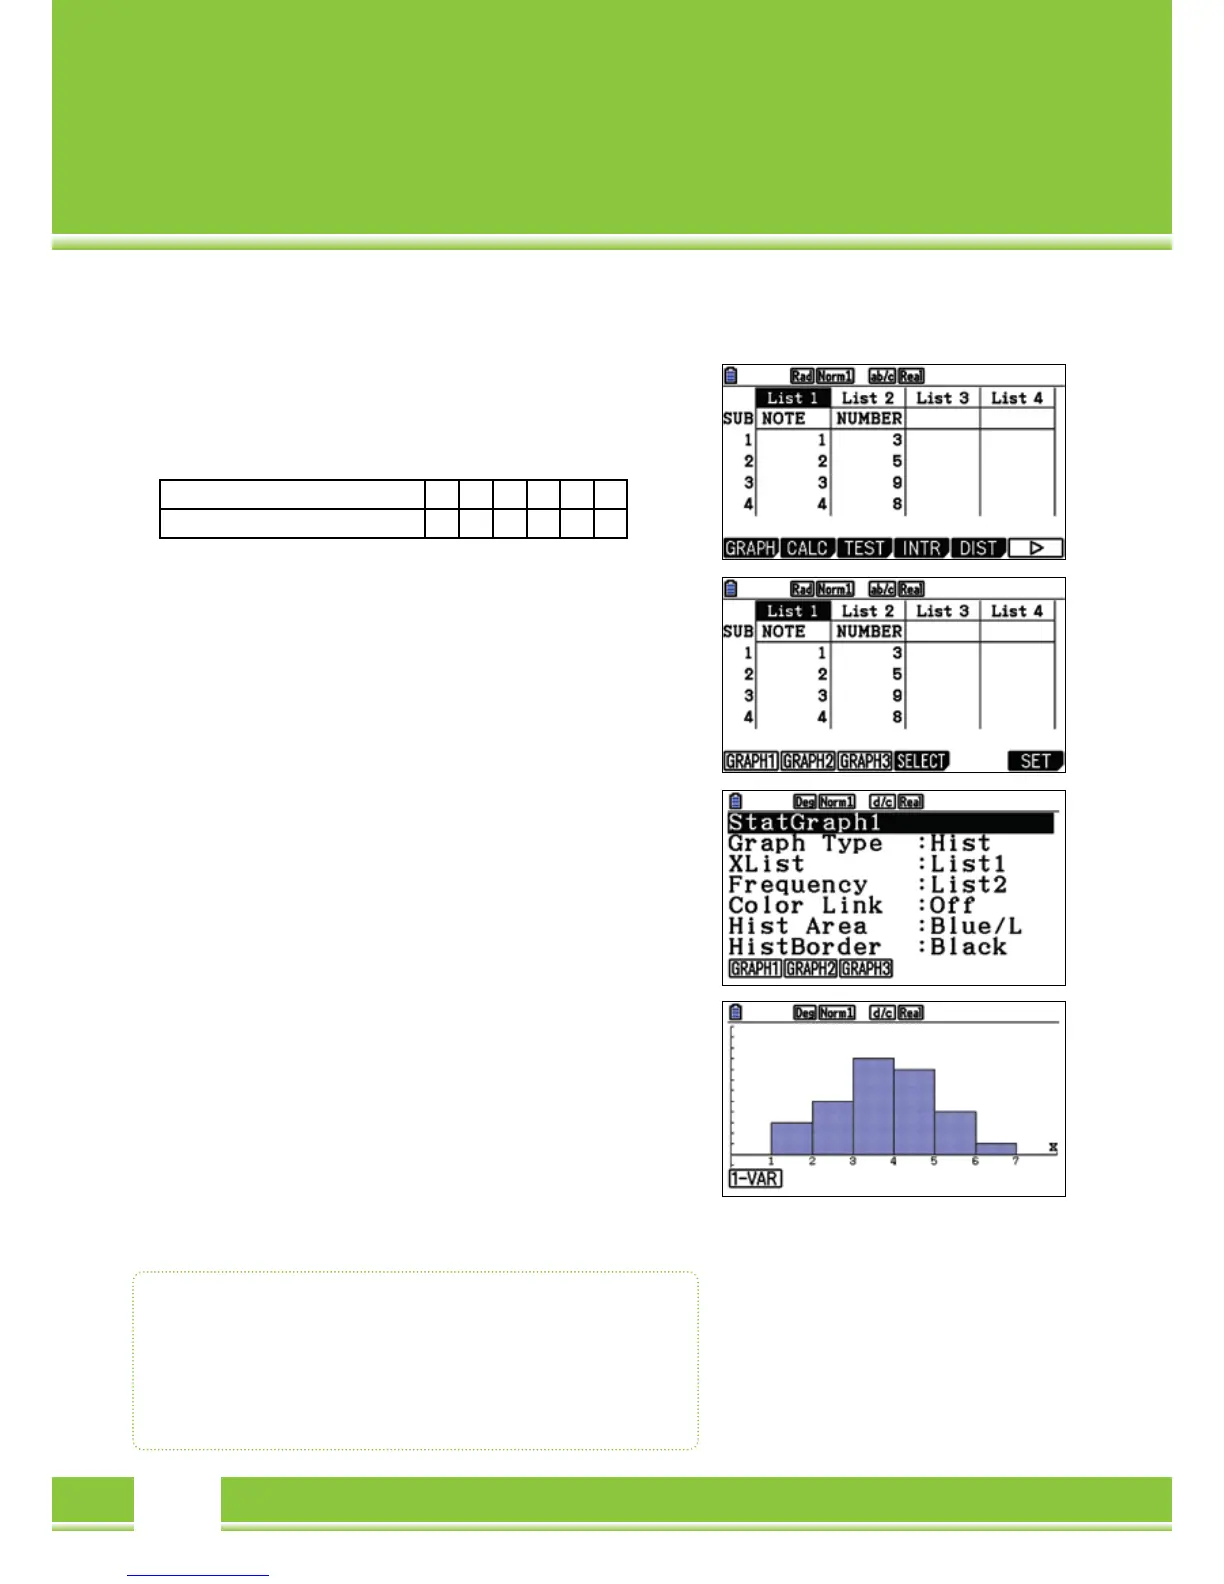
Enter the Data into the list: end each entry with
[
EXE
]
In the cell SUB,
the list with a name can be provided.
Graphical representation of Step 1: Example of Histogram
For a graphical representation of Data,
[
F1
]
(
GRAPH
)
is selected.
It can show up to three graphs
(
StatGraph1, 2 and 3
)
simultaneously.
The Graphic is set with
[
F6
]
(
SET
)
:
Stat Graph1
Graph Type: Hist
[
F6
]
[
F1
]
Xlist: List of features
(
noted from 1-6
)
Frequency: Frequency list for the values in Xlist:
Data is selected with
[
F2
]
[
2
][
EXE
]
Graphical representation of Script 2: Example of Histogram
Select the statistical graph with
[
F4
]
(
SELECT
)
,
[
F1
]
should be displayed.
Represent the graph with
[
F4
]
(
SELECT
)
and subsequently,
[
F6
]
(
DRAW
)
A new window will automatically open: Histogram settings
Start: Enter value to be drawn from
(
here 0
)
Width: Width of the bars
(
here 1
)
The TRACE-function-
[
SHIFT
]
[
F1
]
recalls and controls the Histogram
with the Cursors. Below, the corresponding values are displayed.
Return to the Statistics editor with
[
EXE
]
Statisitcs Application
• Enter Data in Lists
• Show up to three graphs simultaneously
• Graphcical Representation: for instance, Histogram,
Pie and Bar Chart