Regression
With the given or calculated data, it is possible to create the
Regression and determine the function terms.
Note
(
Feature
)
0.5 1 1.5 2
Number
(
Expression
)
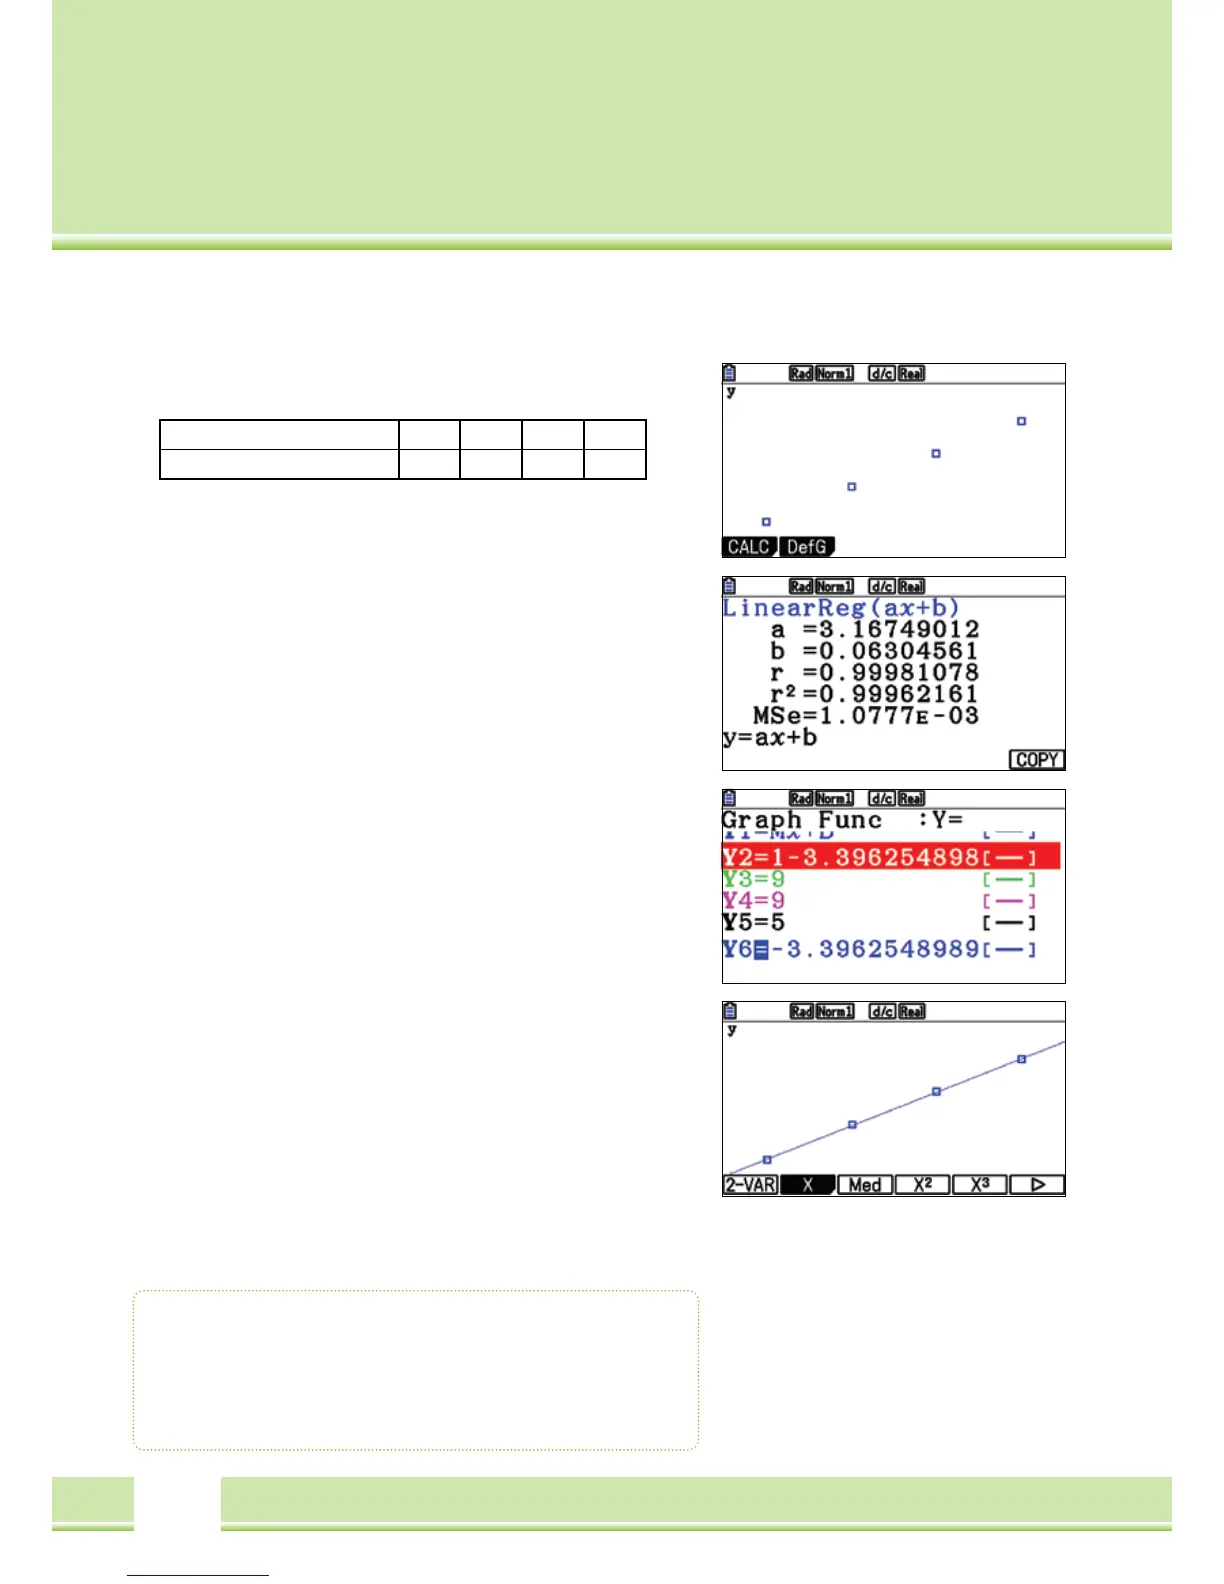
1,58 3,26 4,84 6,38
Regression
Data is given in the list. It is useful, for graphically representing
the data of the regression, e.g. a Scatter graph
(
vgl. Graphical
representation in the Statistics application S.30
)
With CALC
[
F1
]
the Regression type can be selected. For this
example, the linear regression is selected with
[
F1
]
(
X
)
Note: From the List editor, one can be directed to the Settings window
for regression with
[
F2
]
(
CALC
)
(
without graphical representation!
)
Under SET
([
F6
])
some settings are made:
1Var Xlist / 2Var Xlist: x-value of a one or two dimensional
sample.
1Var Freq / 2Var Freq: Frequency values of a one- or data pairs
of a two dimensional sample.
2Var Ylist: Frequency values of a two dimentional sample.
The entries are confirmed with
[
EXE
]
With REG
([
F3
])
the different regression types can be changed.
Saving the Term
The result can be saved in one of the 20 function memories with
[
F5
]
(
COPY
)
, so that it can be used in other applications
(
Graphic,
RUN-MAT, etc
)
. Select a free space and confirm with
[
EXE
]
Graphing the Regression
The regression is shown graphically with
[
F6
]
(
DRAW
)
Regression
• Regression types: X
(
Linear
)
, x^2
(
Quadratic
)
,
Exp
(
Exponential
)
, etc.
• Save the Regression function.