TRACE
[
F1
]
With the TRACE-function
(
follow
)
, graphs can be “expired”, e.g. for
a first overview on a graph. Additionally, you can put special items
together into a table of values using the TRACE- function.
TRACE
[
F1
]
Select the TRACE-function with the
[
F1
]
-button. Now, the graph can
be expired using the Cursor- keys
(
<
)(
>
)
When displaying multiple graphs, Select the Graph with
(
^
)
(
down
)
and
[
EXE
]
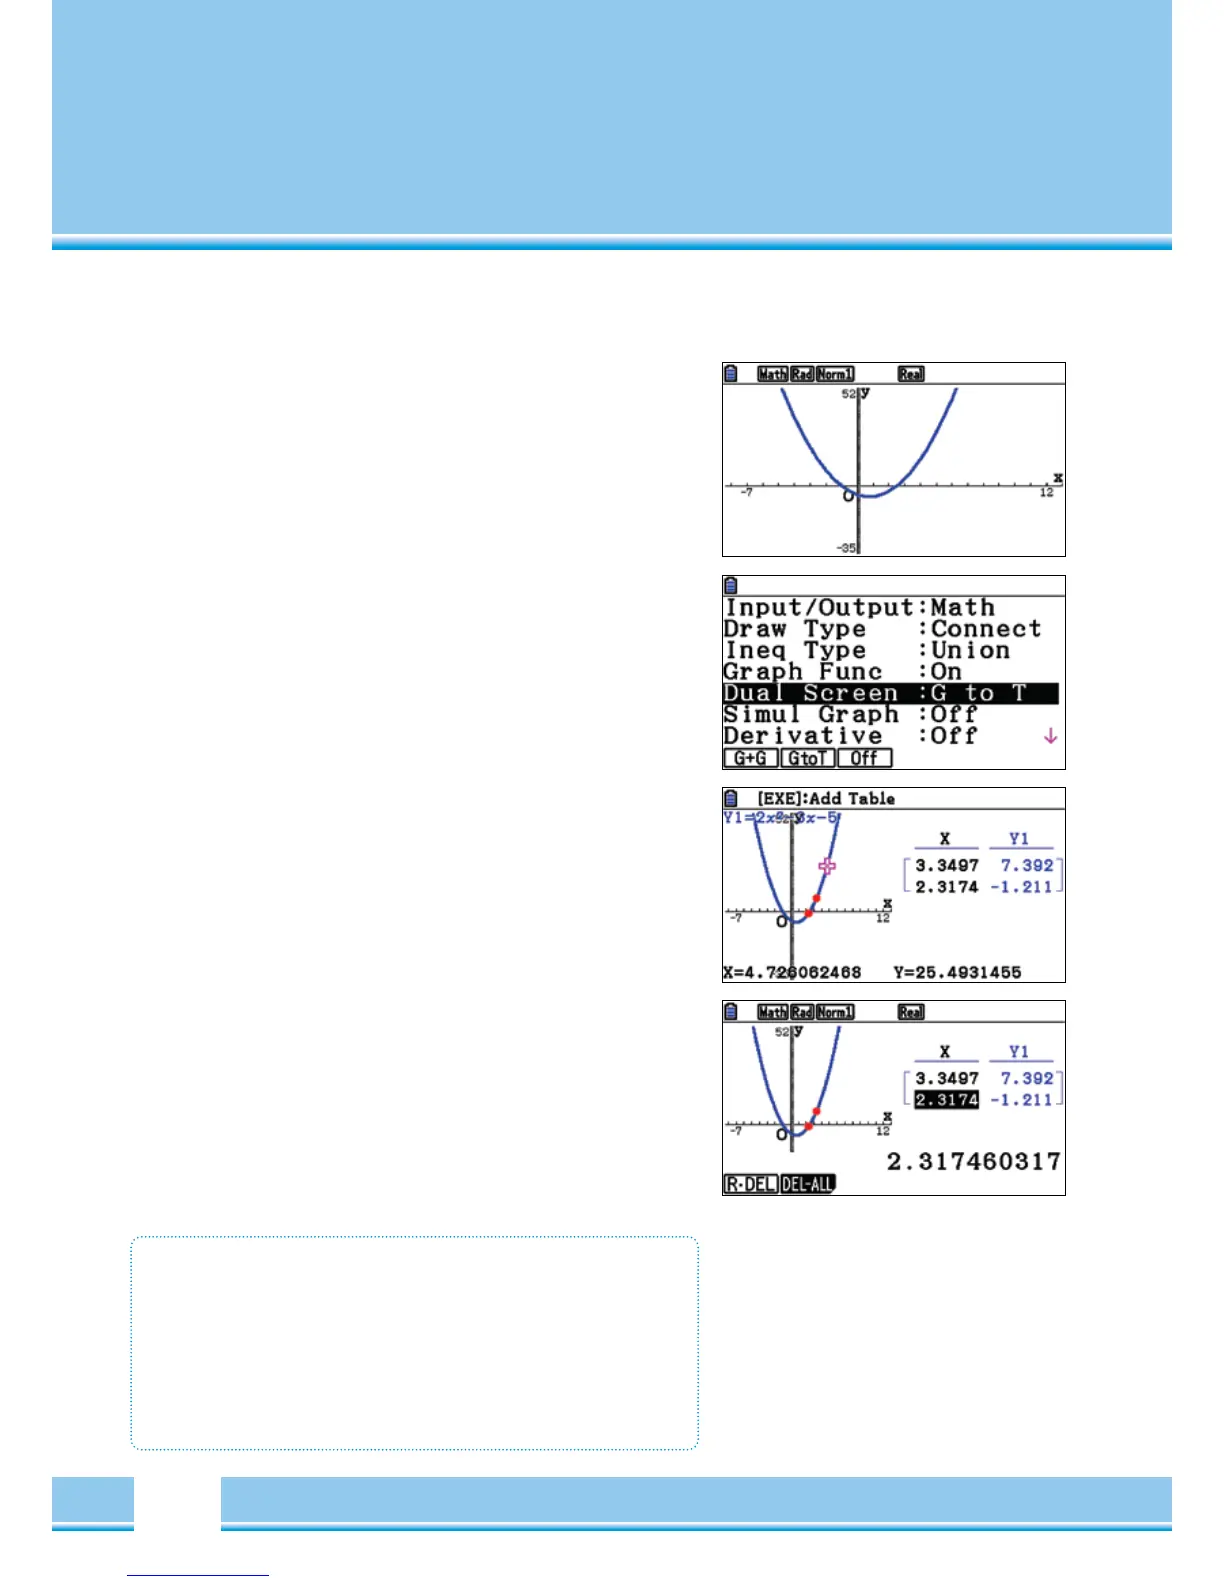
TRACE with Split Screen
(
Dual Screen
)
To document the values at certain points, the Setting split screen is
selected: To recall the SETUP press
[
SHIFT
]
[
MENU
]
To select the Dual Screen, “GtoT”
(
Graph to Table
)
use
[
F2
]
TRACE: Documented values
Navigate the split screen mode with the Cursor keys
(
<
)(
>
)
and confirm
the values that should have been added to the value table with
[
EXE
]
The item is included in the value table.
Edit Table
Using
[
OPTN
]
[
F1
]
, the table entries can now be changed,
individual or all entries are deleted.
R-DEL Deletes a row.
A-DEL Deletes the entire table.
TRACE- To Call
•
[
F1
]
TRACE
• Navigate with the Cursors
(
<
)(
>
)
• By entering a value, a point can be accessed directly.
• A point can be emphasised with
[
EXE
]
• Split screen
(
Dual Screen function
)
to create a table of values.