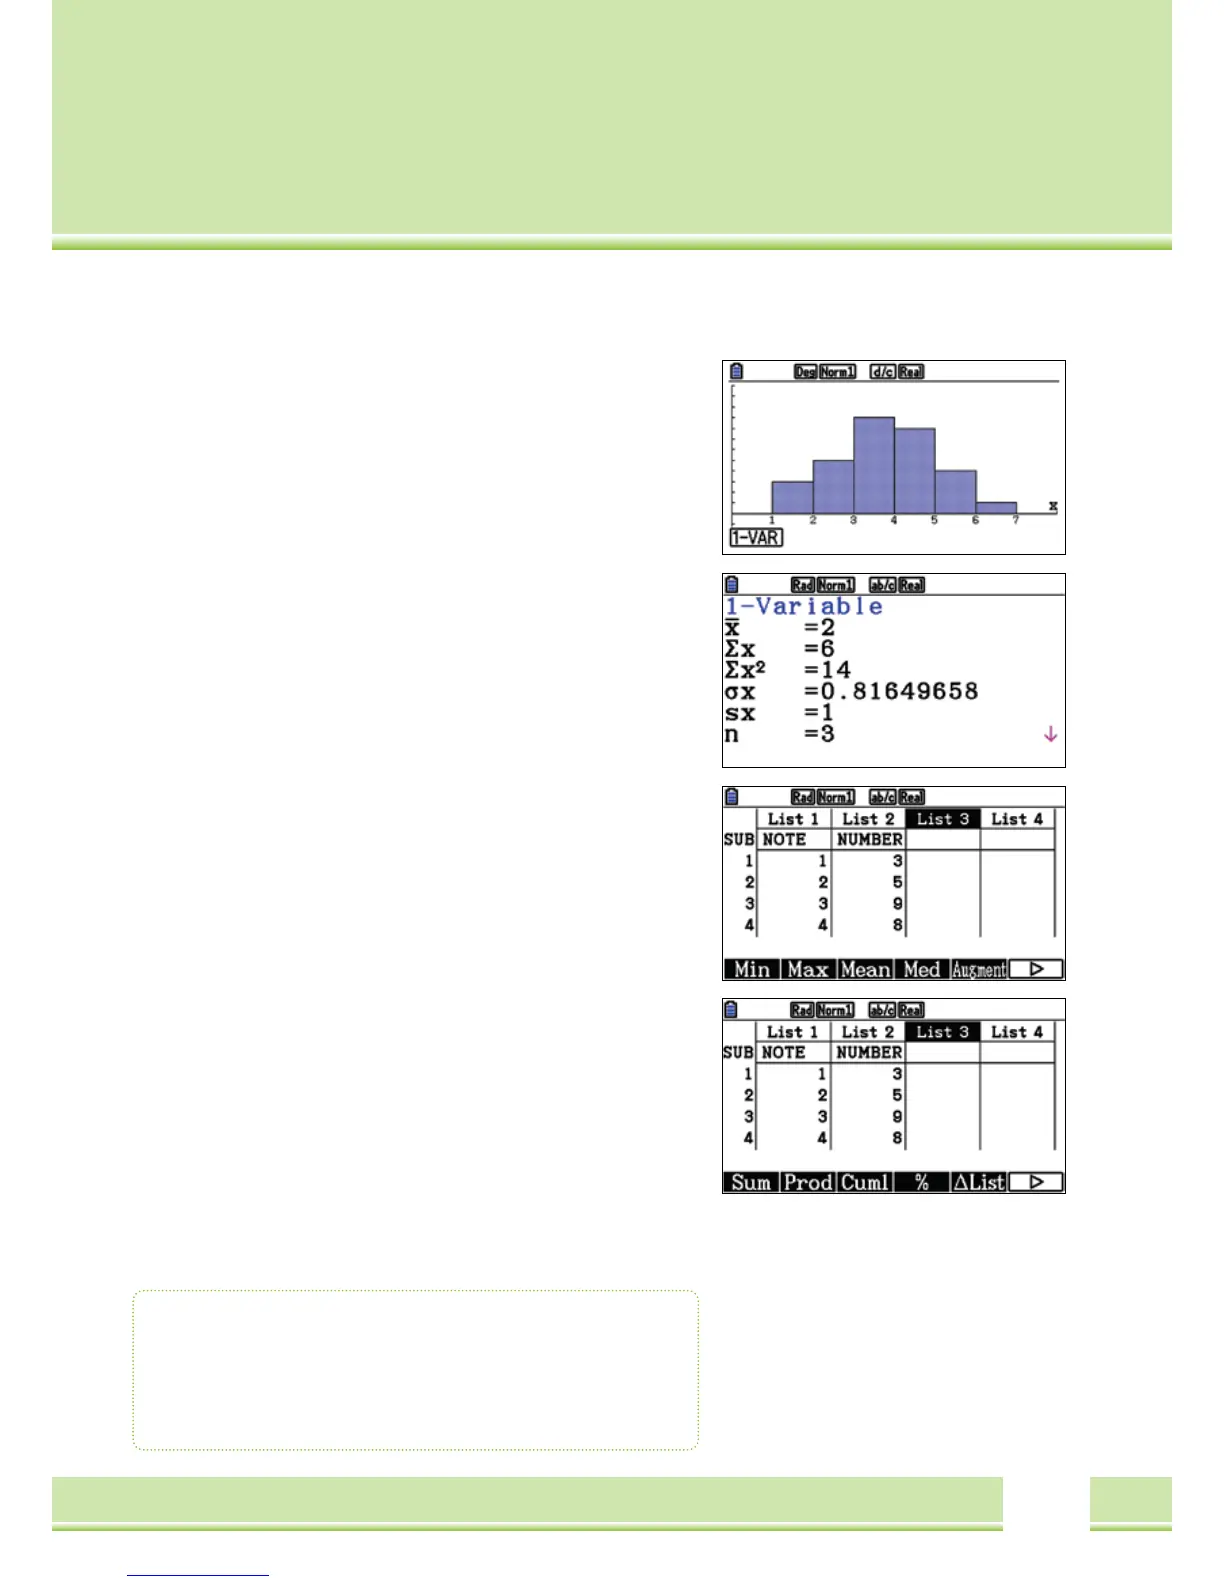
Evaluation of the Histograms
The statistical parameters and for instance, the mean
(
X
-
)
, the sum of
the squares of data
(
∑x2
)
or the standard deviation
(
σx
)
are shown
using
[
F1
]
(
1-VAR
)
Instructions for editing Lists
For processing lists, various commands in the statistics application as
well as in the RUN-MAT application are available:
[
OPTN
]
[
F1
]
(
LIST
)
[
F6
]
(
>
)
Min
(
Minimum
)
, Max
(
Maximum
)
, Mean
(
Mean
)
, Med
(
Median
)
[
F6
]
(
>
)
Sum
(
Sum
)
, Cuml
(
Cumulative frequency
)
, etc.
Statisitcs Application
• Analysis of statistical parameters of a graph
(
one dimensional
)
; 1-VAR
• Recalling commands list:
[
OPTN
]
[
F1
]
(
LIST
)
[
F6
]
(
>
)