Image Plotter –
Analyse Images
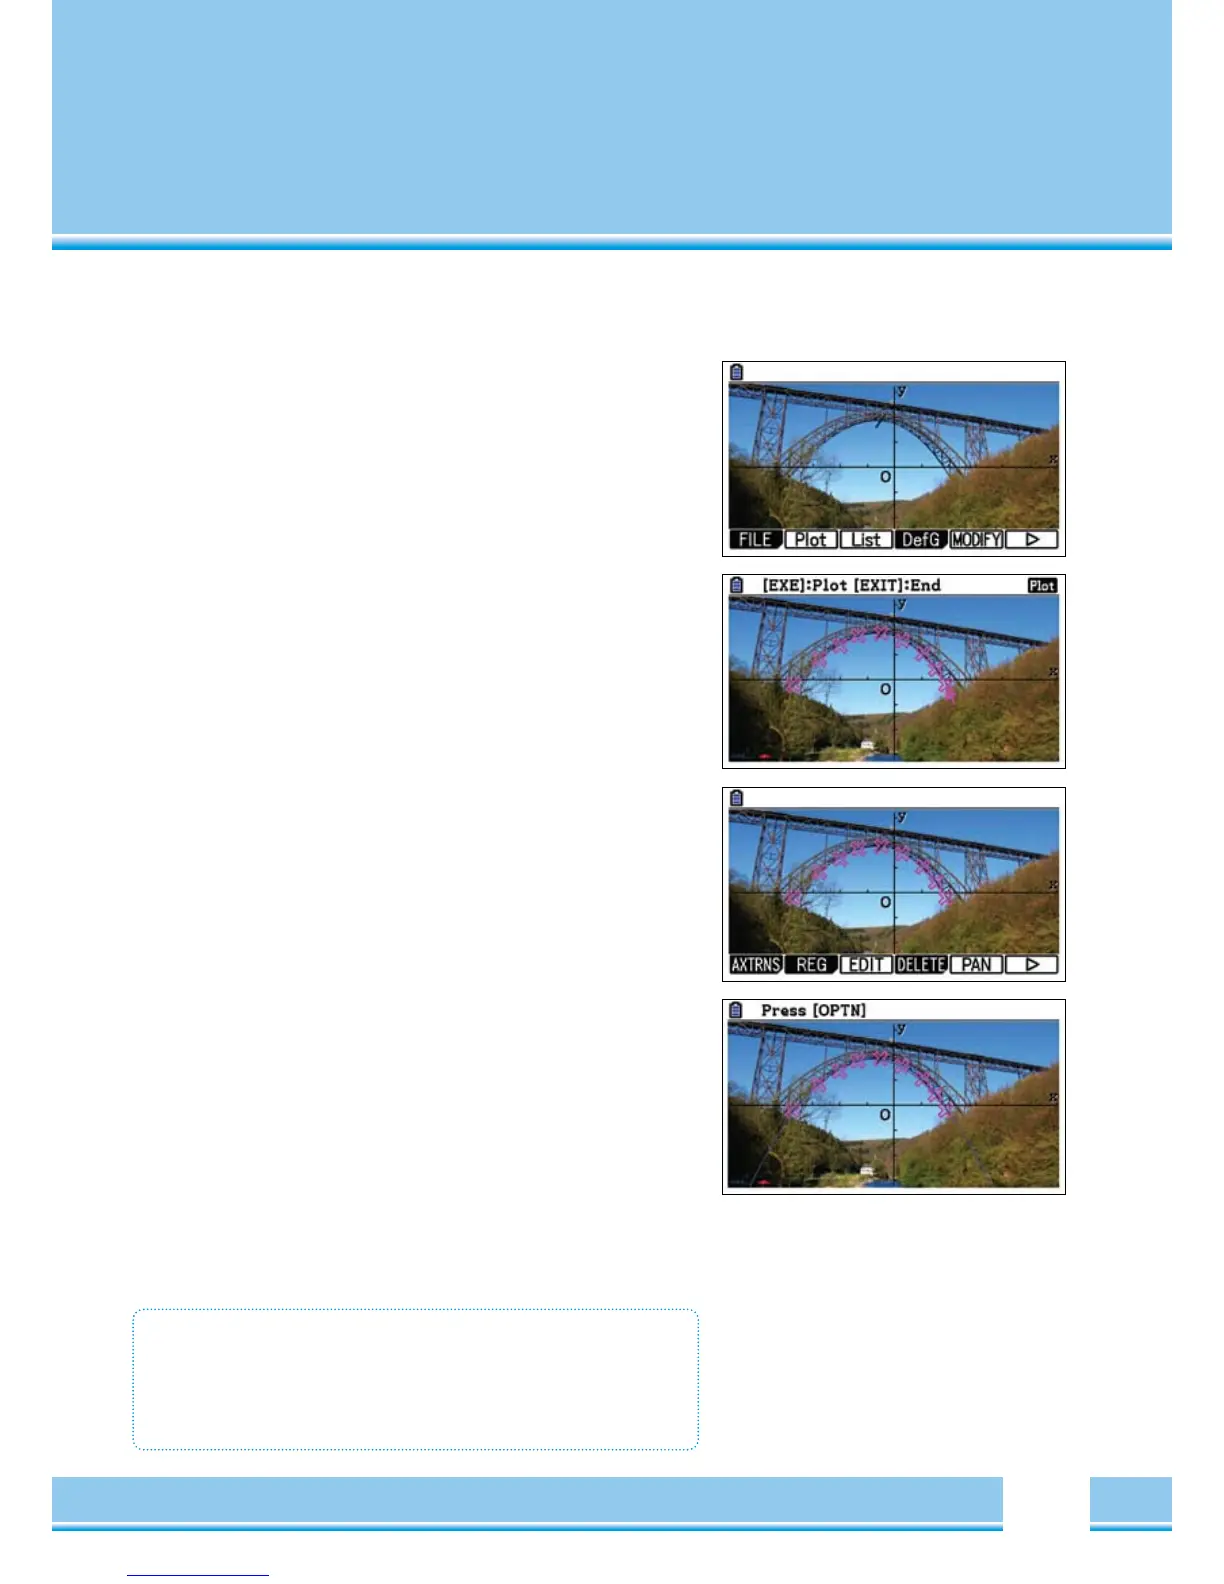
Images can now be analysed- Points can be drawn and evaluated.
Points, “Plotting”
If the image is loaded, it allows the coordinate system to be adjusted
with the Cursor keys.
[
OPTN
]
For further commands.
[
F2
]
Plot
Now, points can be plotted with the Cursor keys and the
[
EXE
]
- key.
Pay attention to a “clean” sequence of points since the points are
automatically written in to a variable list.
End the plot with
[
EXE
]
Regression
When the plot is stopped, press
[
OPTN
]
again and go to a further
page with
[
F6
]
. There one will find REG
([
F2
])
The menu behaves in the same way as in the statistics.
Analysing Images
• Points in the image can be plotted with PLOT
• Use the plotted points for a regression