38
Binomial Distribution
Example: Simulation of a cube experiment
Calculate the probability that at the 30th dice roll:
a
)
5-times
b
)
X-times
a 6 is rolled.
Proposed Solution for b
)
X={1,2,...30}
(
Number of rolls
)
;
N=30
(
Number of trials
)
’
p=1/6
(
probability of success
)
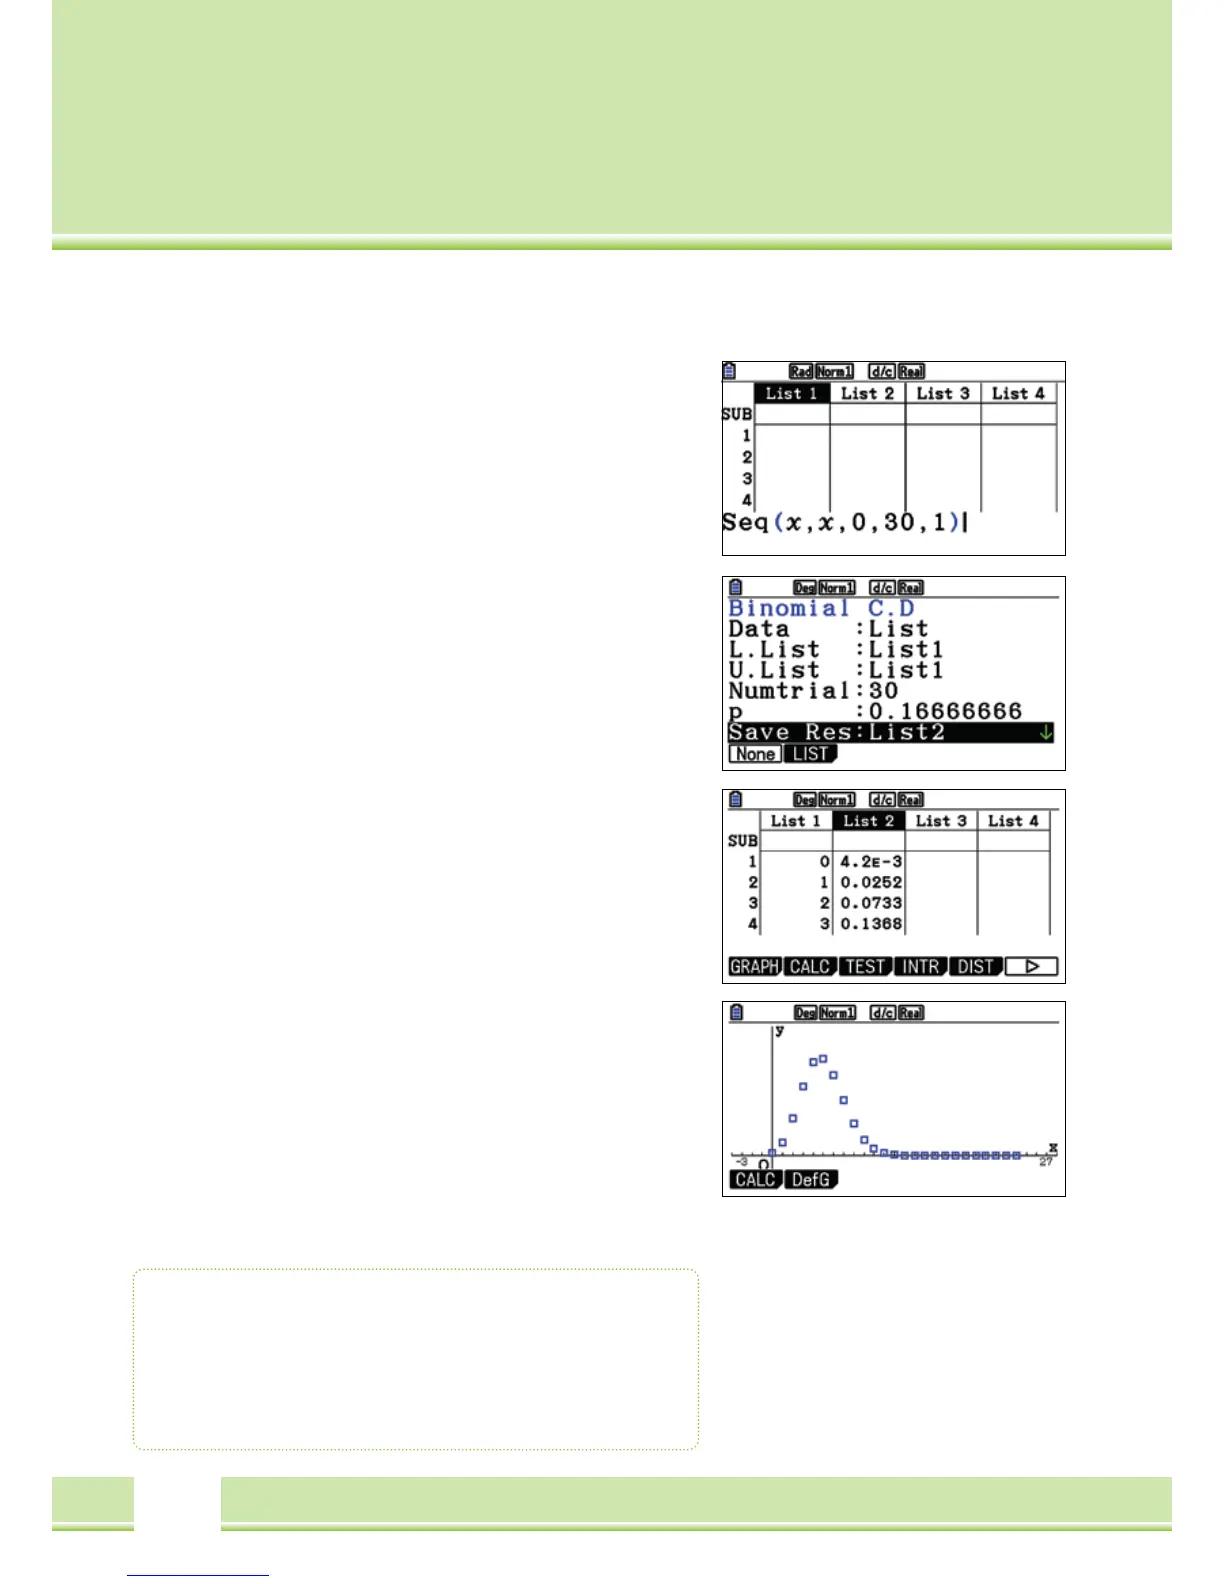
The list of number of rolls is hit with the seq-command
(
follow
Command
)
to create a list in List 1. From there the cursor is on
“List 1” and then enter the result:
[
OPTN
]
[
F1
]
(
LIST
)
[
F5
]
(
Seq
)
Syntax: Seq
(
Formula, Variable, Start value, End value, range
)
Select the command Bpd with
[
F5
]
(
DIST
)
[
F5
]
(
BINM
)
[
F1
]
(
before you return with
[
EXIT
])
and enter the values.
Confirm the input with
[
EXE
]
. Store the results under “Save Res”,
e.g. indicate List2. Run the calculation with
[
EXE
]
Return to the Statistics window with
[
EXIT
]
[
EXIT
]
Graphical Representation
The results can be observed graphically, e.g. as xy-Polygon is shown
(
vgl. S.30
)
Note: The Binomial Distribution can also be shown in the Graphics-
application.
Binomial Distribution
• Binomial Distribution Command in the Statistics application:
[
F5
]
(
DIST
)
[
F5
]
(
BINM
)
• Bcd calculated the summed probabilities
P
(
0
)
+ P
(
1
)
+...+P
(
X
)