GE+ ACDC Installation and operation manual v11
73 / 121
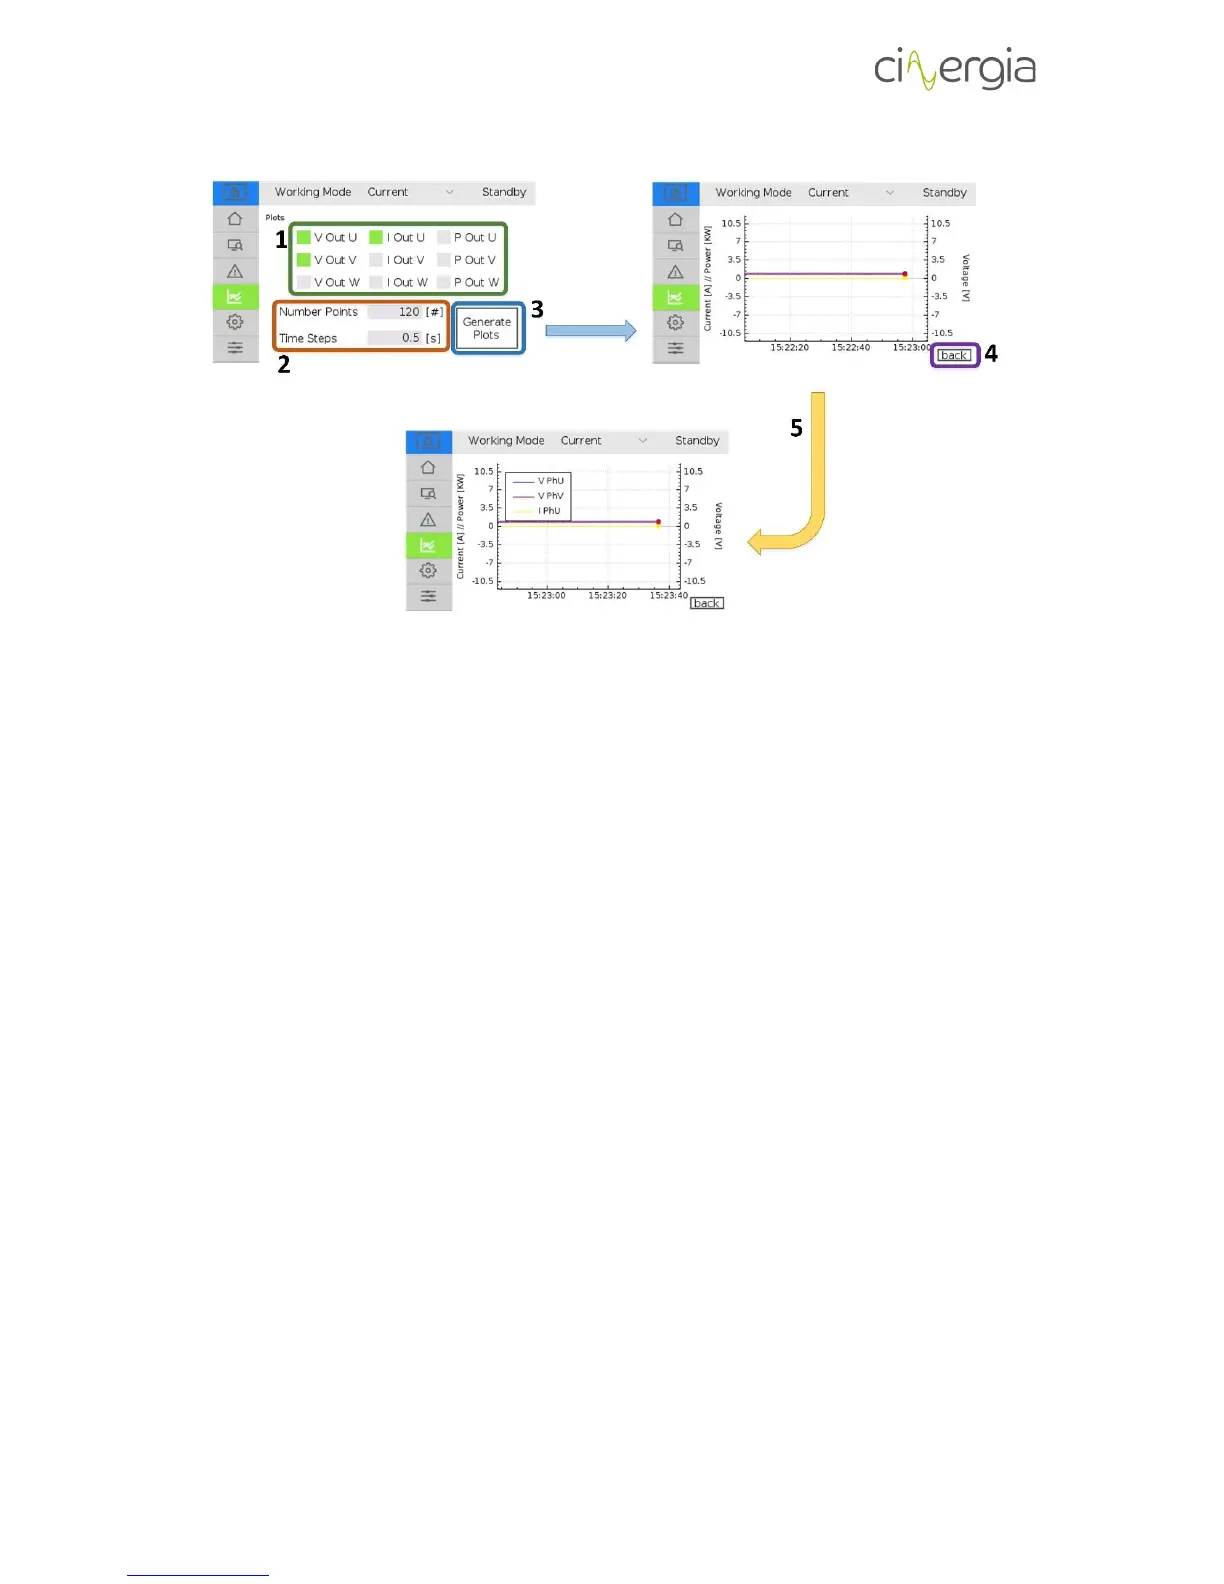
1. Select the items you want to be in the plot. The available parameters are output voltage,
current and power for each phase. The selected items are illuminated in green. To
deselect them, press the left square again and they will be not illuminated anymore.
2. The plot will get the value of the selected items in 1 every time indicated in Time Steps.
The Number of Points are the points that will appear of the same item in all the
horizontal axis. For example, if the Number of Points is 120 and the Time Steps is 0.5s
(default values), the plot will get values of the selected items in 1 every 0.5s and the
horizontal axis will show 120 · 0.5 = 60s of points.
3. Once the items are selected and the numbers in point 2 are ready, press Generate Plots.
The horizontal axis is for the time whereas the verticals ones are for the current and
power (left) and voltage (right).
4. Press back to return to the plots menu.
5. By pressing anywhere in the generated plot, it will appear the legends with the colors
and the items being created in the graph. Pressing the plot again, the graph legends will
disappear.
6.3.5. Settings
In this tab, the user will be able to introduce all the configurations and parameters of the
equipment. The following schematic describes the available functions of this tab: