5
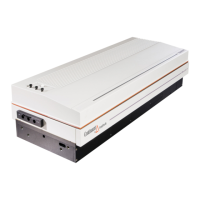
Figure 1-4 shows the Q-switch build-up time as the seed laser frequency is scanned through the
host gain curve. The expanded view shows that, as the piezo is translated in either direction from
the exact optimum frequency overlap condition, the effect on the Q-switch build-up time is the
same.
Figure 1-4: Host Laser Buildup Time vs. Seed Laser Frequency
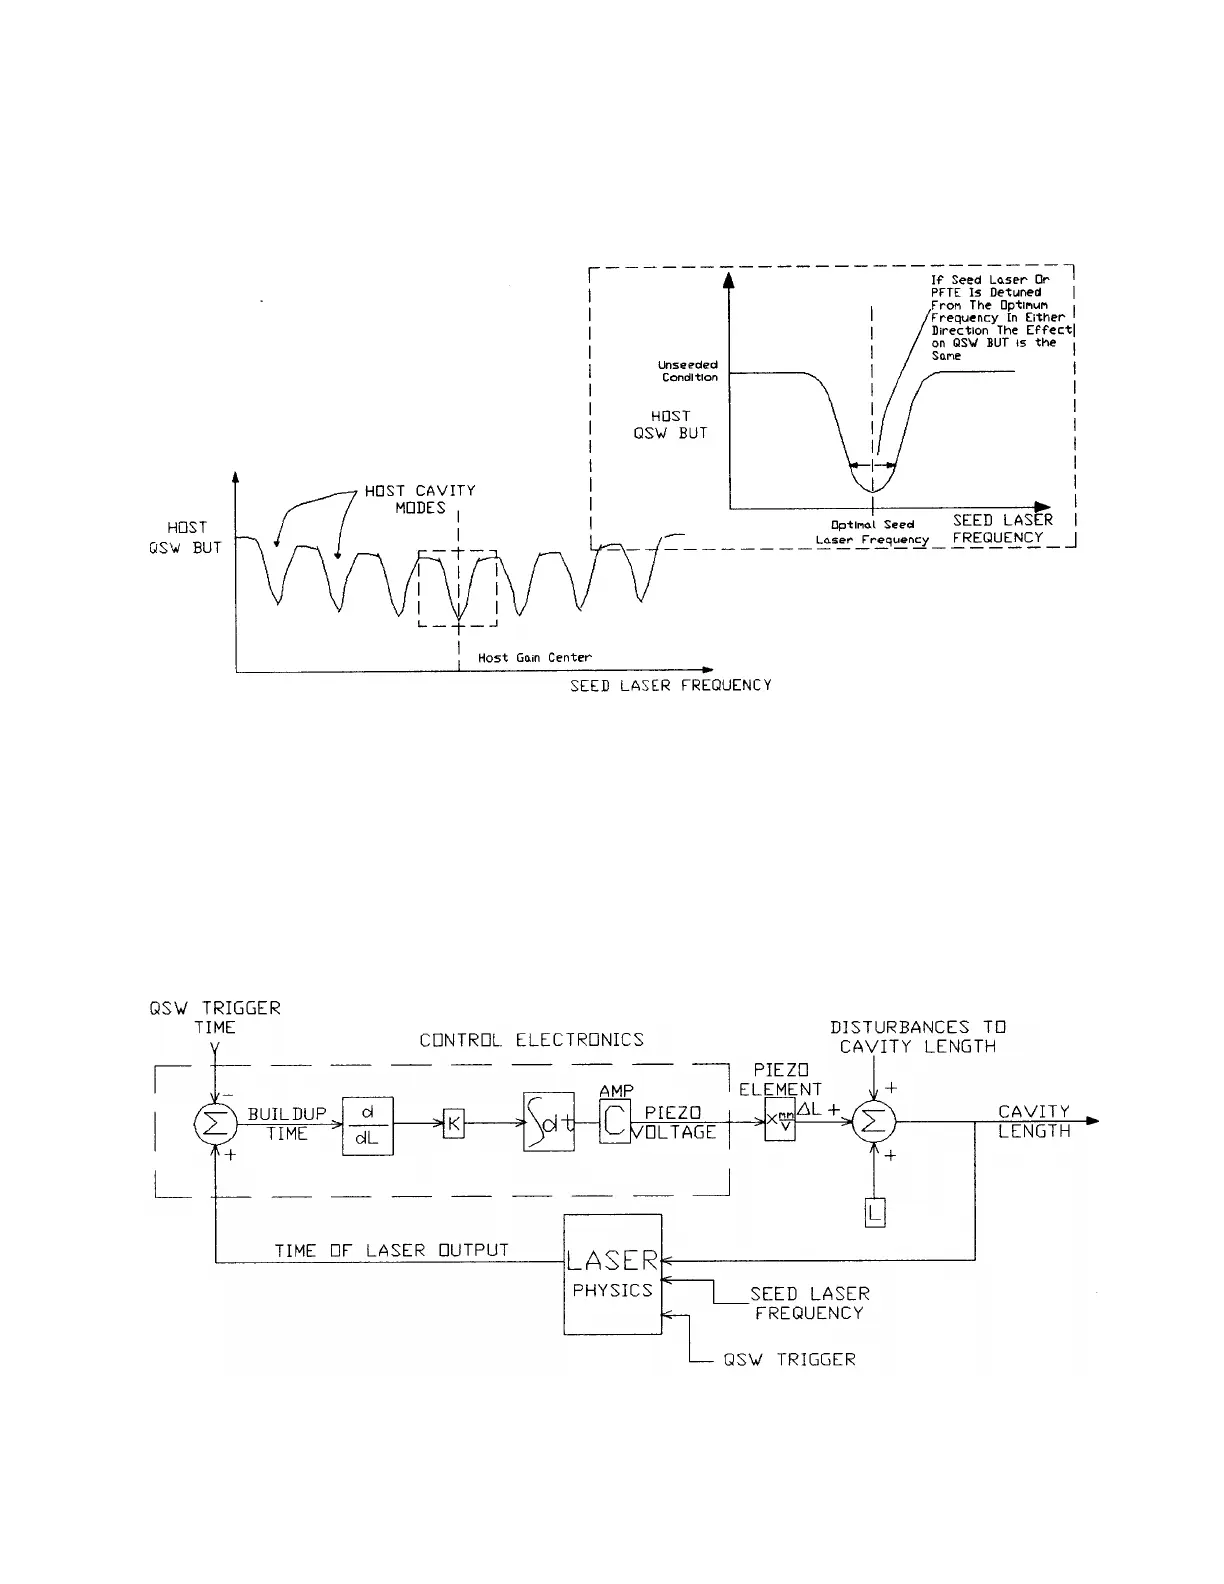
The control loop block diagram for build-up time minimization is shown in Figure 1-5. To
minimize the Q-switch build-up time, the control electronics develop an error signal using the
derivative of the build-up time with respect to the host cavity length (ðT
b
/ðL). This essentially is the
slope of the curves in Figure 1-4. When the error signal is zero the Q-switch build-up time is
minimized for that cavity mode. This signal is integrated over time to produce the piezo control
voltage.
Figure 1-5: Frequency Control Loop-Block Diagram