5.2.6 Pressure flow curve
P
lot the result
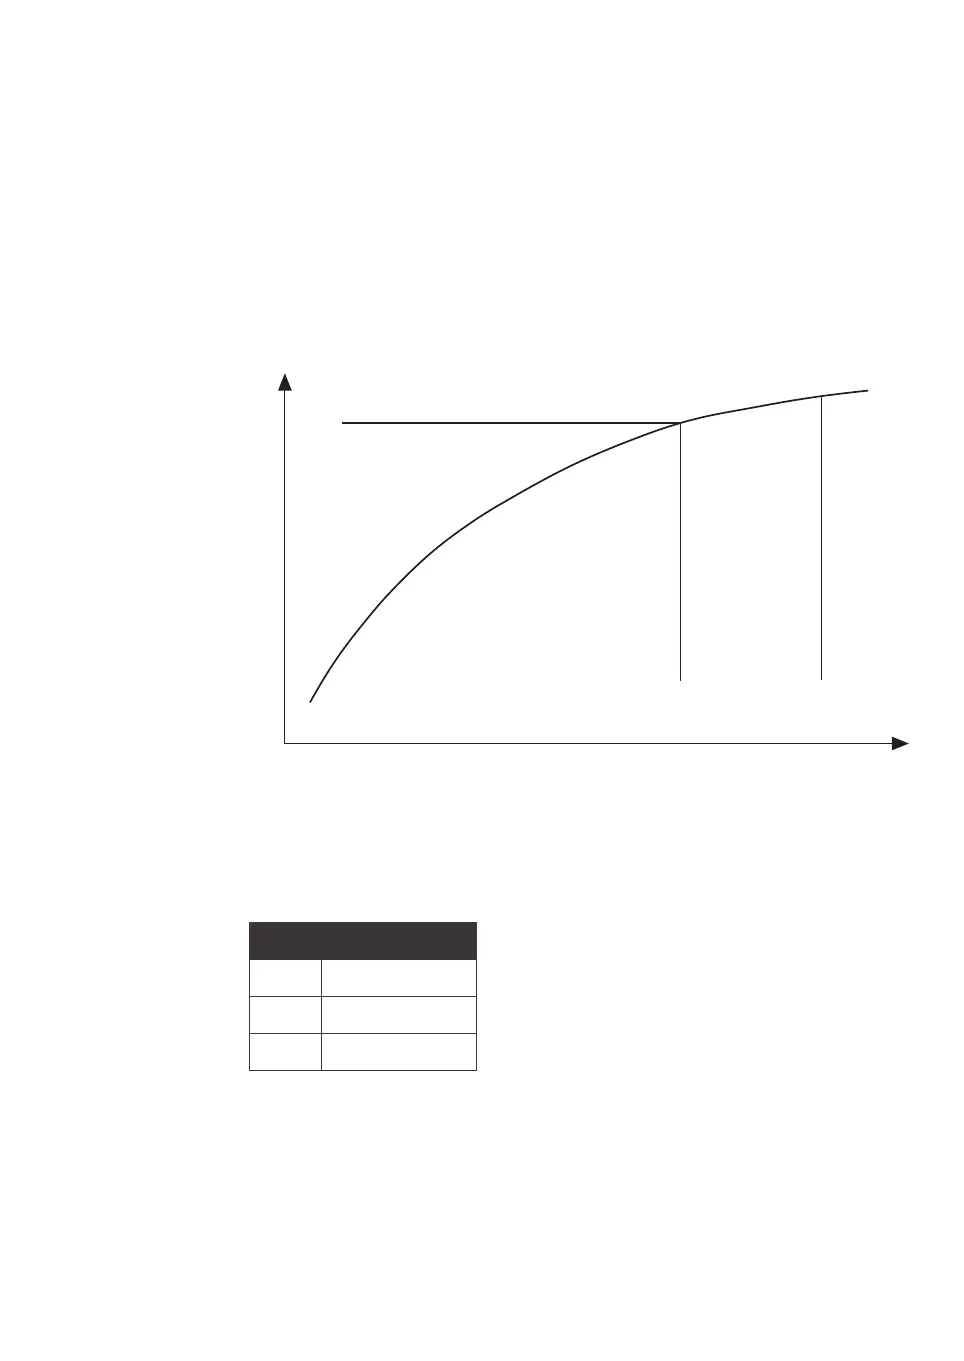
Plot the pressure in the flow rate, as indicated in the below example. The optimal
packing flow rate is about 70% of the maximum flow rate. For some very rigid media
there will be no plateau, in those cases use the flow rate at maximum allowable pres-
sure for the column. The figure below shows the pressure flow curve.
The description of the axis are:
x
= Pressure
y = Flow rate
The characters in the table are described below:
Value Meaning
a Packing flow rate
b Packing pressure
c Max pressure
5 Operation
5
.2 Column packing
5.2.6 Pressure flow curve
BPG Columns Operating Instructions 29193223 AB 71