xStack® DES-3200 Series Layer 2 Managed Fast Ethernet Switch
262
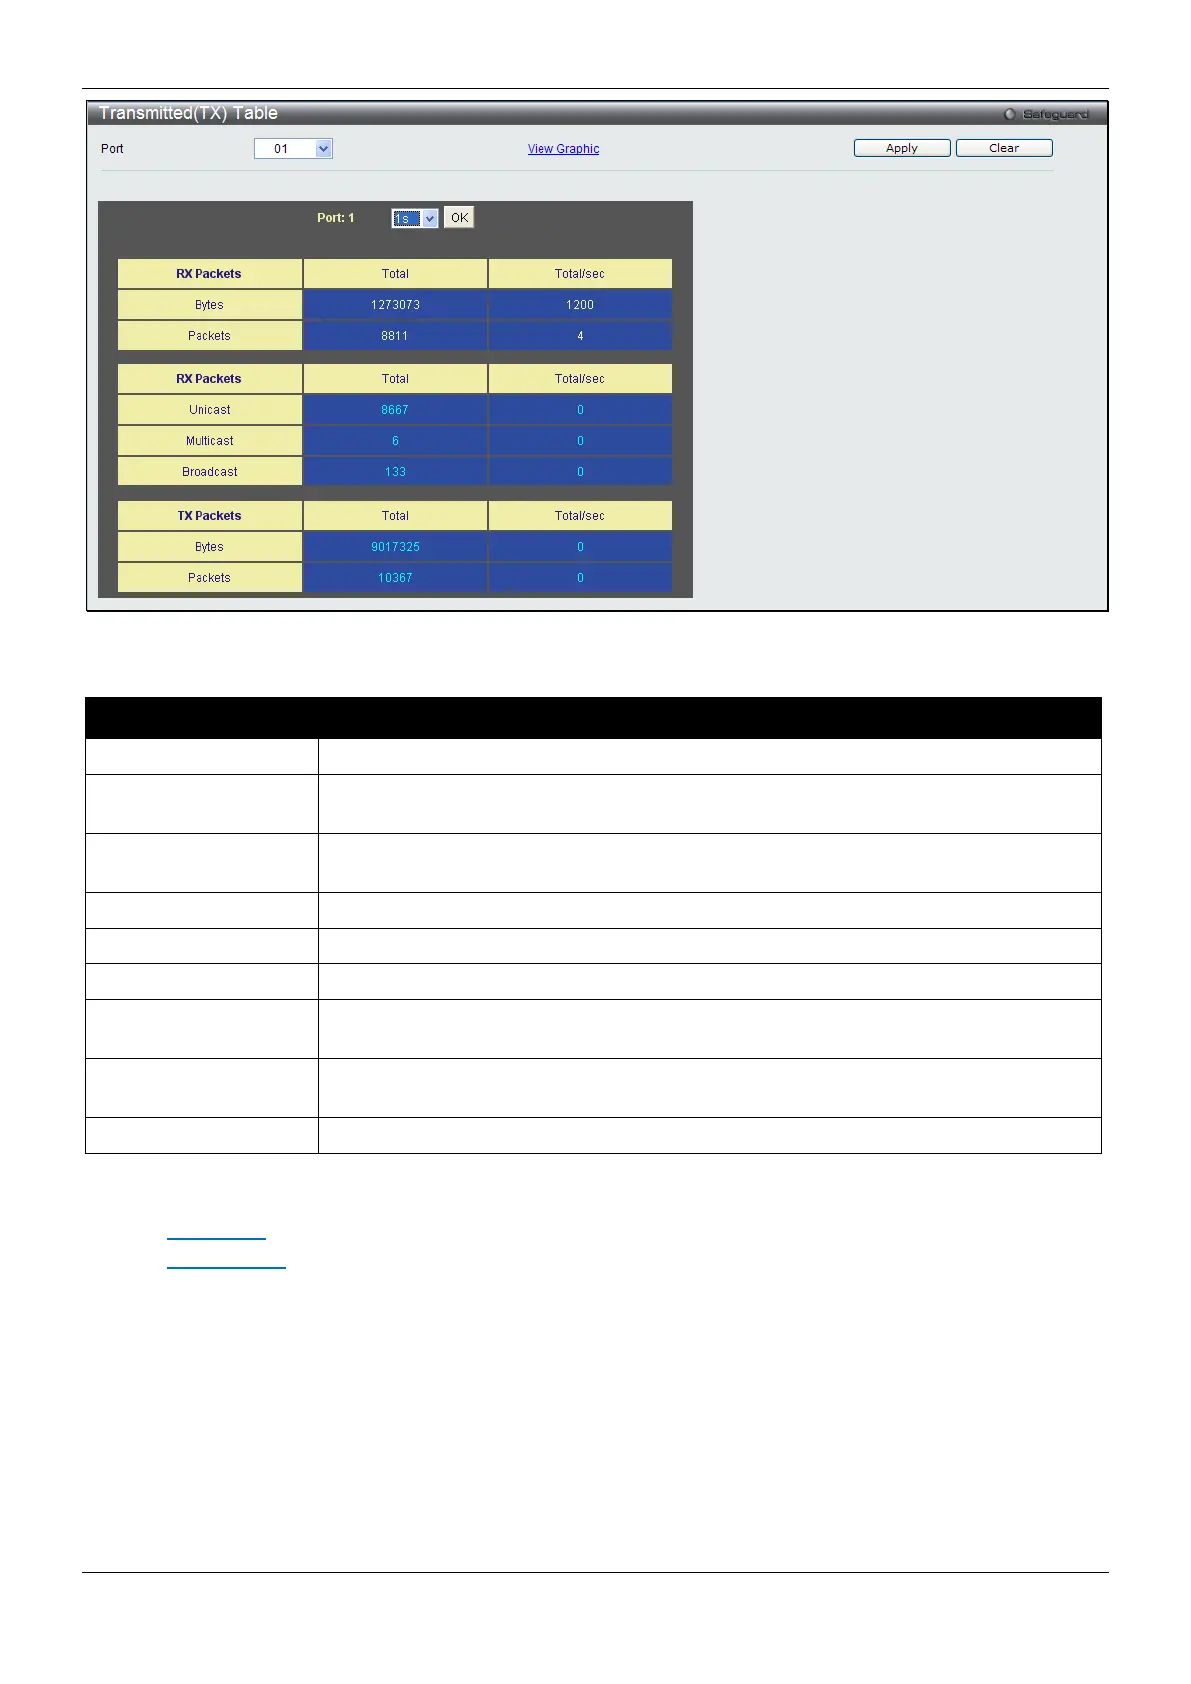
Figure 11-9 TX Packets Analysis window (table for Bytes and Packets)
The fields that can be configured or displayed are described below:
Parameter Description
Use the drop-down menu to choose the port that will display statistics.
Time Interval Select the desired setting between 1s and 60s, where "s" stands for seconds. The
default value is one second.
Record Number Select number of times the Switch will be polled between 20 and 200. The default
Counts the number of bytes successfully sent on the port.
Counts the number of packets successfully sent on the port.
Counts the total number of good packets that were transmitted by a unicast address.
Multicast
Counts the total number of good packets that were transmitted by a multicast
Broadcast
Counts the total number of good packets that were transmitted by a broadcast
Check whether or not to display Bytes and Packets.
Click the Apply button to accept the changes made for each individual section.
Click the Clear button to clear all statistics counters on this window.
Click the View Table
link to display the information in a table rather than a line graph.
Click the View Graphic
link to display the information in a line graph rather than a table.
Errors
The Web manager allows port error statistics compiled by the Switch's management agent to be viewed as either a
line graph or a table. Four windows are offered.
Received (RX)
To select a port to view these statistics for, select the port by using the Port drop-down menu. The user may also
use the real-time graphic of the Switch at the top of the web page by simply clicking on a port.
To view this window, click Monitoring > Statistics > Port Statistics > Errors > Received (RX) as shown below:
 Loading...