vPad-A1 OPERATORS MANUAL
4.4.2.5 Cardiac Output – Simulation Curve
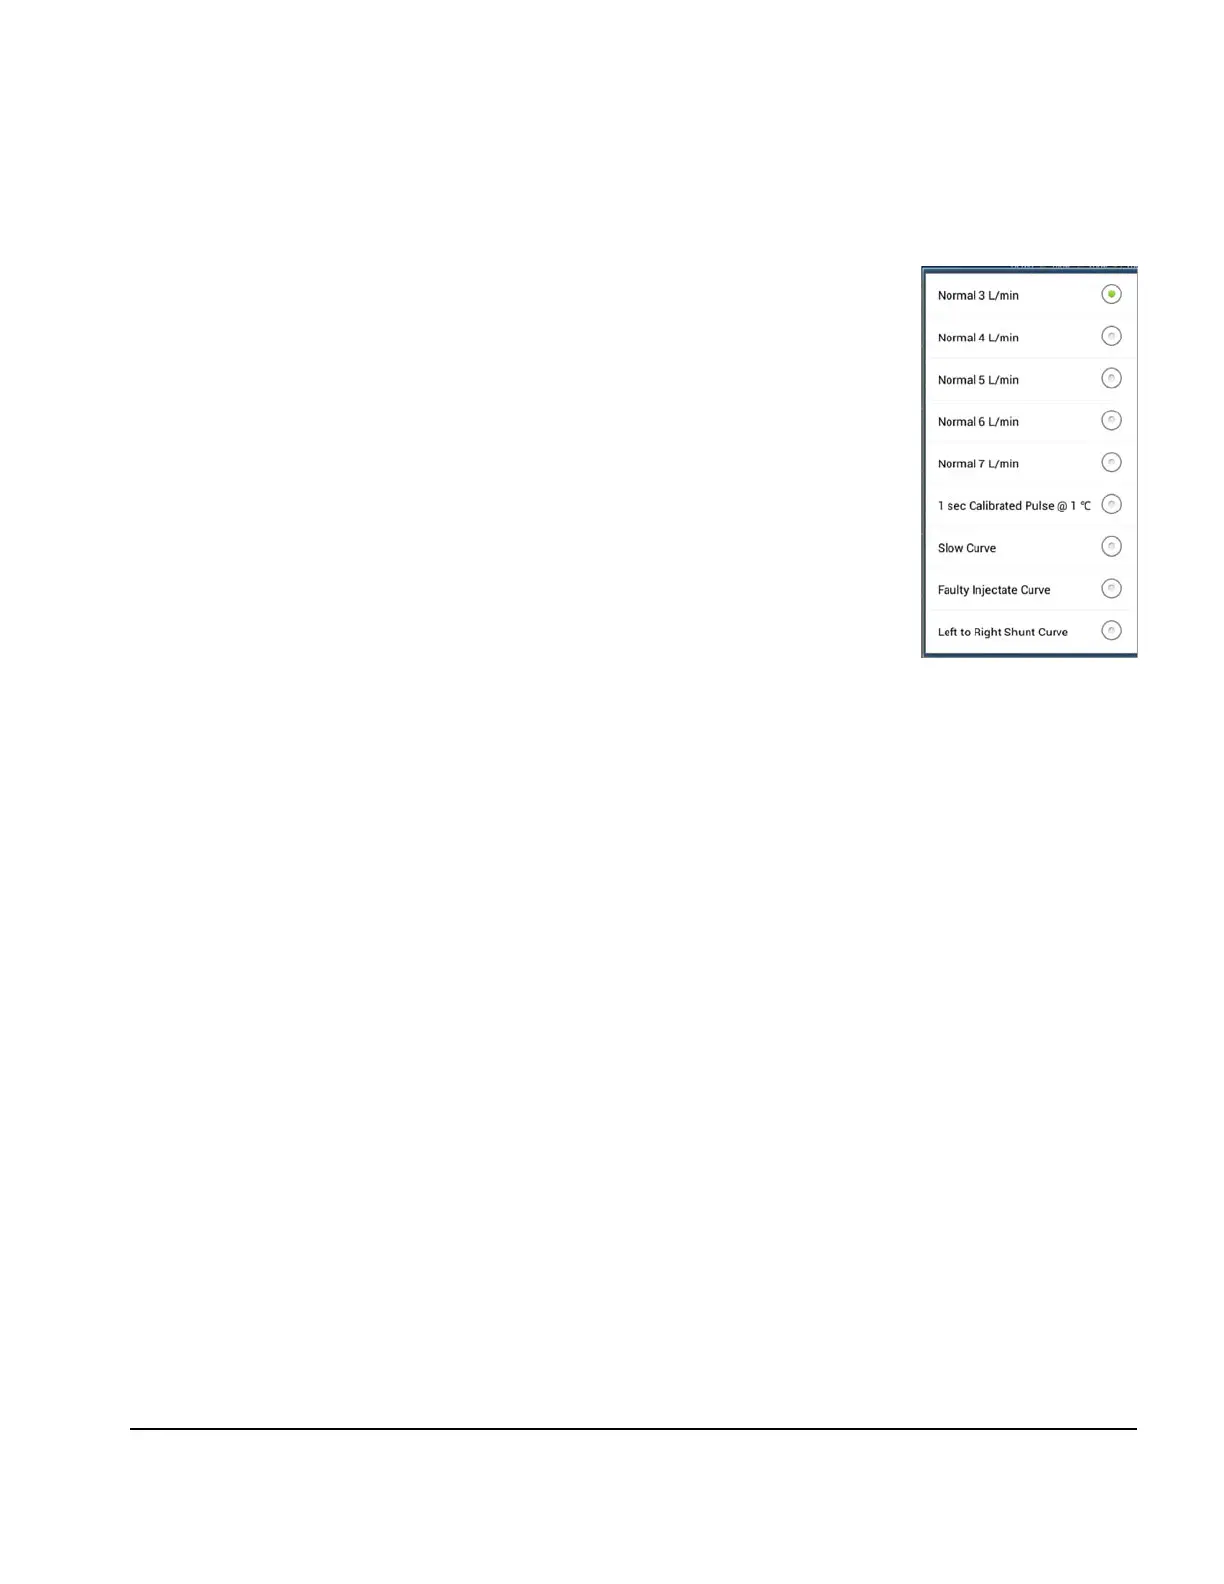
The Simulation Curve sets the shape of the temperature variation as blood
temperature downstream is cooled due to Injectate Temperature and then
returned to Baseline Temperature. Users can choose from a set of regular
curves representing a normal thermodilution routine or from a set of test
curves, as shown in
Figure 54
.
A Start button will appear after choosing a Simulation Curve. Pressing the
button will initiate or restart the simulation.
Figure 54
Manual Operation/Chapter 4 # Page 45

 Loading...