- 43 -
Interactive Graphs
The Main window can be configured to display none, one, two, three or four interactive graphs using the
Preferences menu.
Changing Graph Type
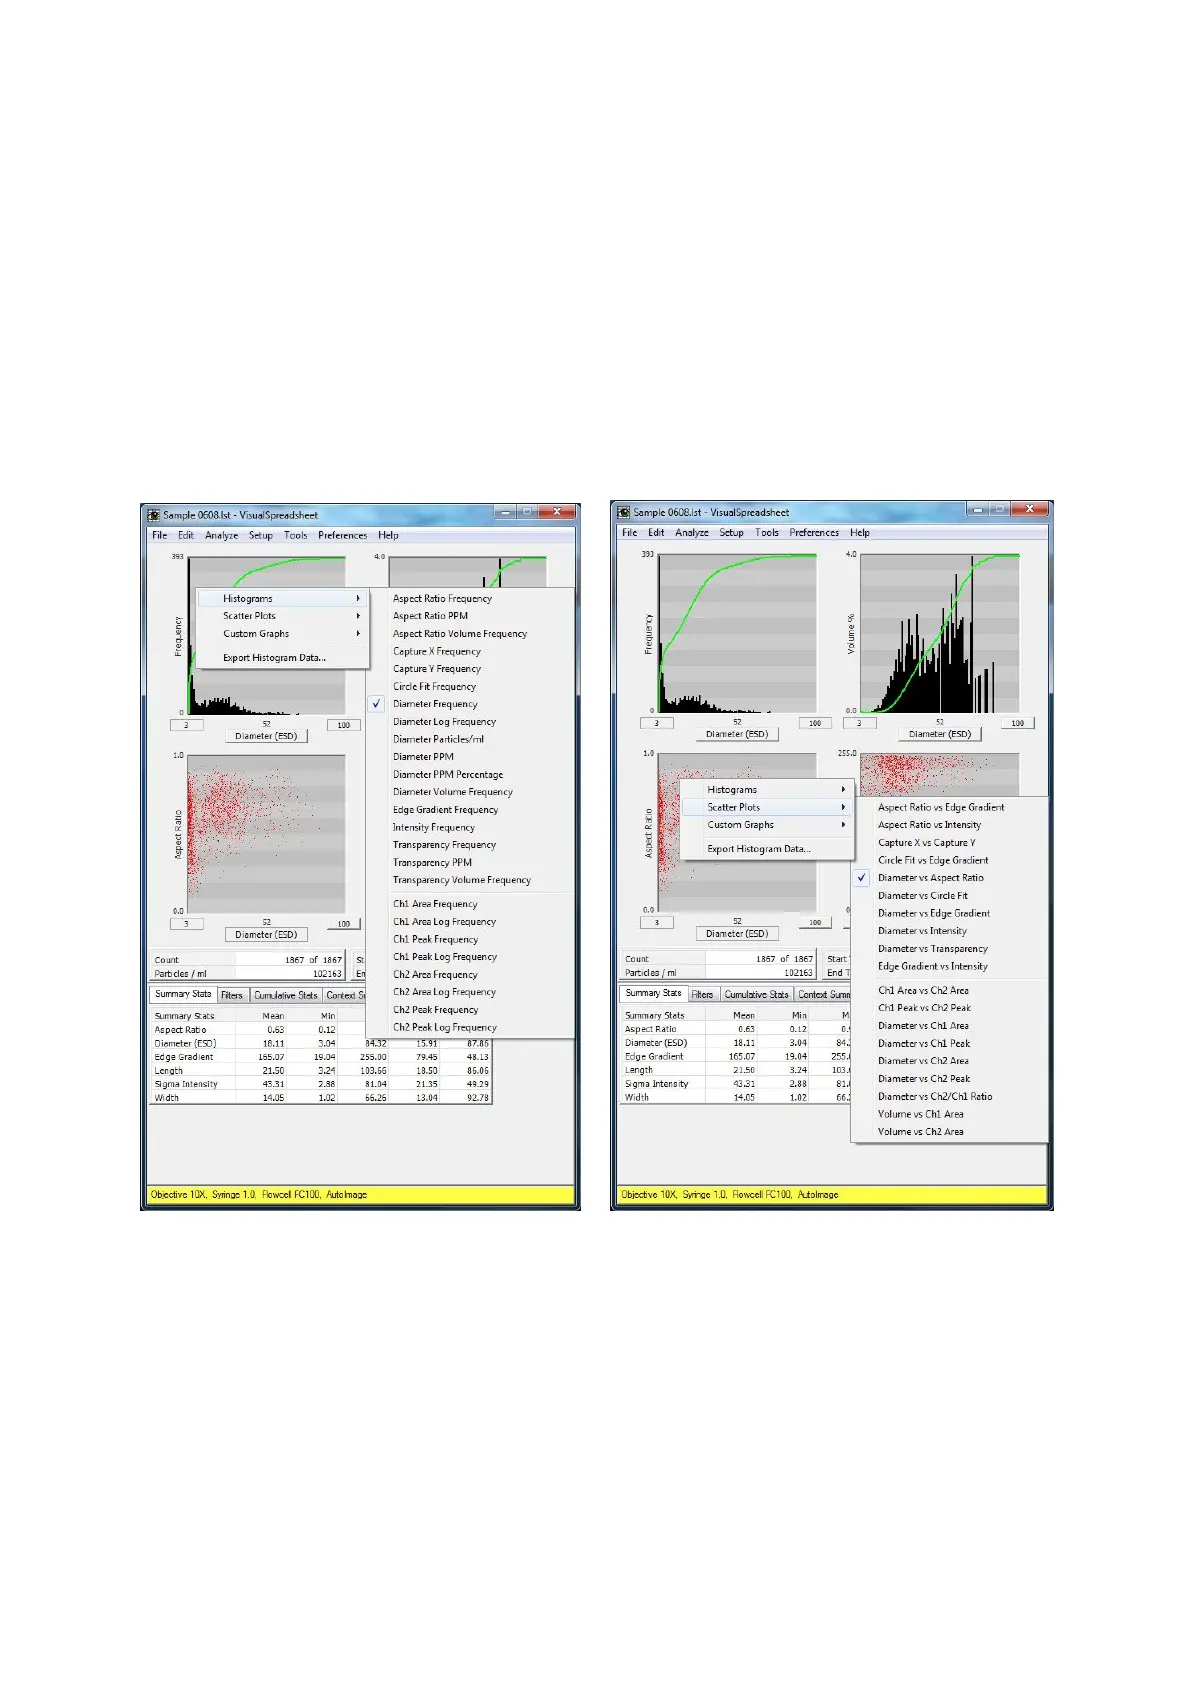
Changing the type of graph being displayed is accomplished by right-clicking on a graph and choosing
another graph from the popup menu. A check mark indicates the type of graph currently being
displayed. See Figure 24 for an example of selecting a Histogram or Scatter Plot.
Figure 24. Right-clicking an interactive graph to display the type and list of graphs that can be
displayed in the Main Window
Custom Graphs
To utilize Custom Graphs, right click on a graph and select the Custom Graphs option. Then select
either the Custom Histogram or Custom Scatter Plot option. Depending on the selection, one of the
following windows will open.