- 44 -
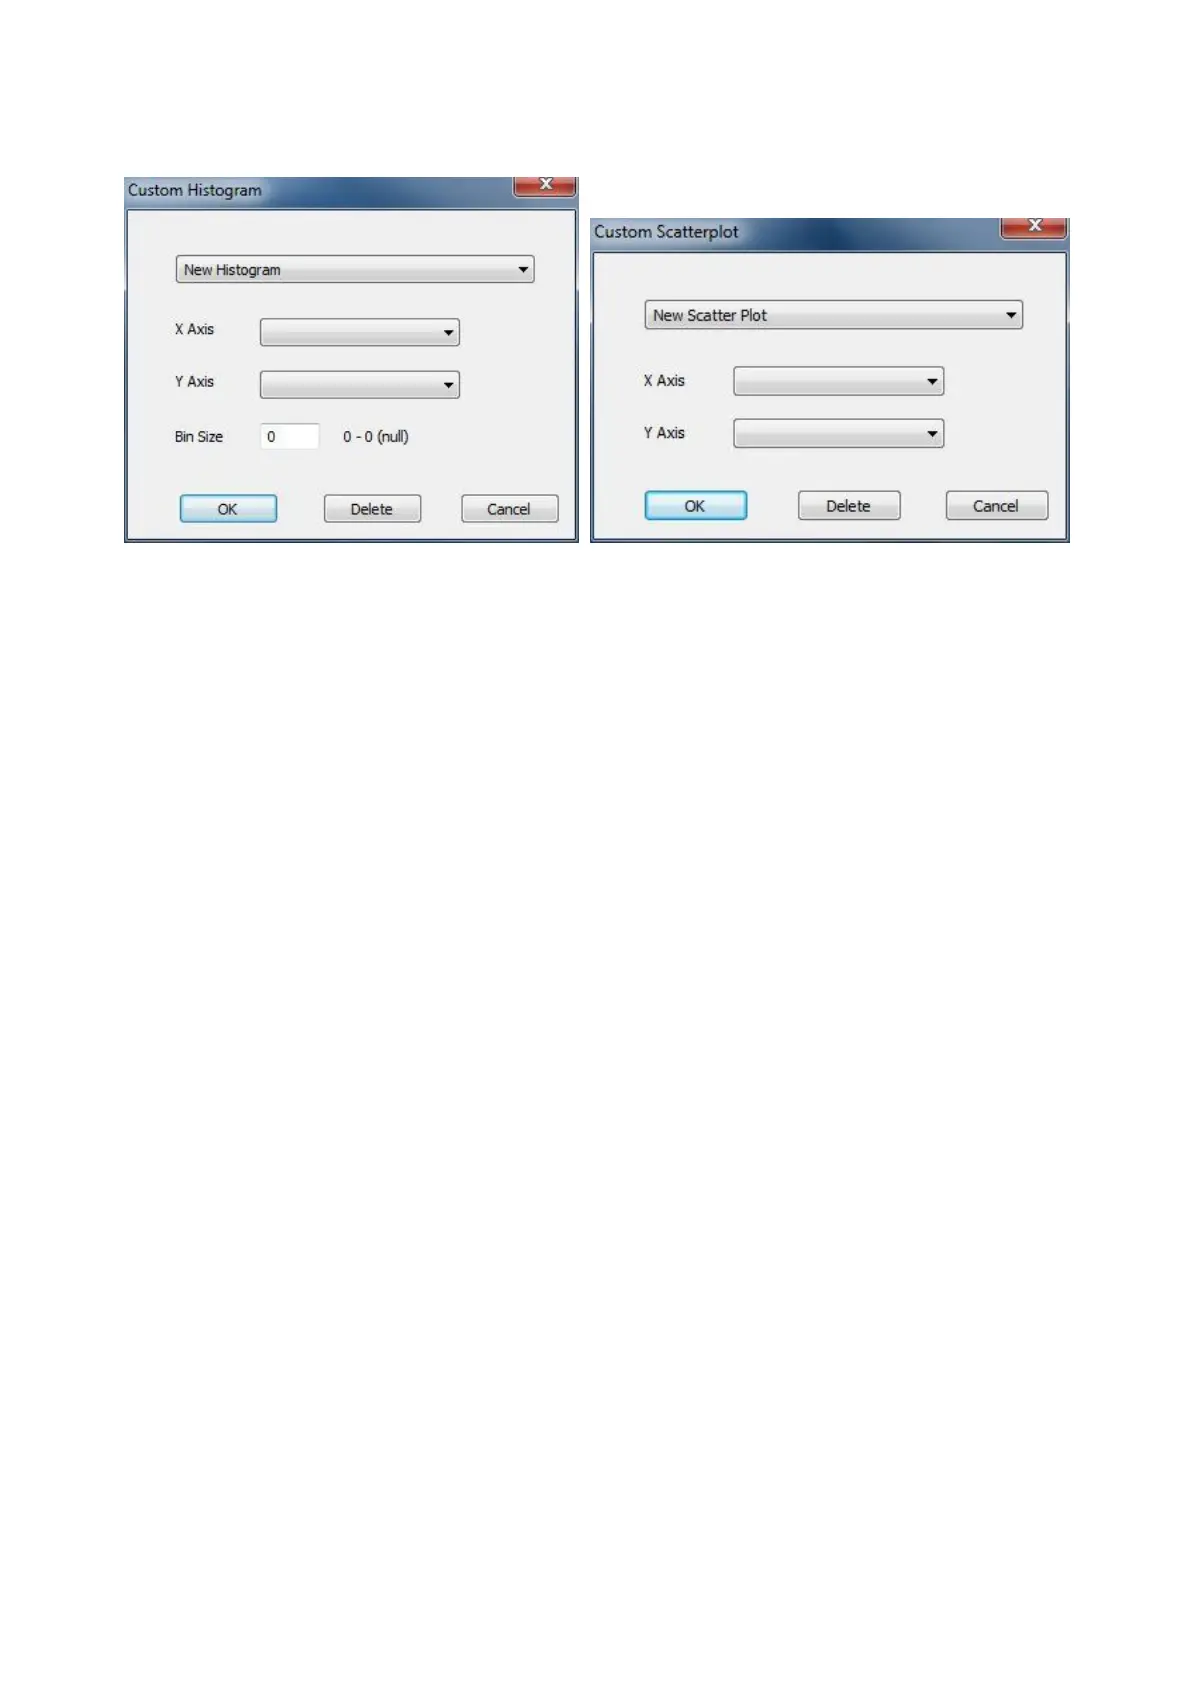
Figure 25. Right-clicking an interactive graph to display the Custom Graph window
To create a new Histogram, select the parameters from the menu list for both the X and Y-Axis. Specify
the Bin Size and click “OK”. The new custom Histogram will be displayed on the Main Window in the
location of the original graph. To locate the newly created Histogram, right click on the graph and select
the Custom Graphs menu. For both custom Histograms and custom Scatter plots, the names of the
available (i.e. user created) graphs will be listed. Further changes can be made to each listed custom
graph (including deletion) by selecting the Custom Graph of interest and utilizing the first drop down
menu (i.e. New Histogram or New Scatter Plot).
Selecting Particles
To select particles using the interactive graphs, left click on the graph, hold the mouse button down and
drag across the region of interest (see Figure 26). This will open the View Window and automatically
populate it with all the particles graphed in the selected area. Alternatively, you can open the View
Window by Edit > Open View Window (F2). Using this alternative method, the View Window will
only display the particles currently displayed on the graph as constrained by the X-Axis values. If the
X-Axis does not display the entire data set, the value for Count will be highlighted as a reminder (Figure
27). To display all of the particles from the data set, select the Show All Data option first: Edit > Show
All Data [F3]. This function will automatically reset the X-Axis to include values that encompass and
display all of the particles from the data set. Therefore when using the F2 hot key, it is recommended
that the user select the F3 key first and then select the F2 key. Finally if utilizing a Filter (displayed in
the Filter Grid on the Main Window) the user can click on and highlight a filter. When the filter is
highlighted, all the particles that satisfy the filter appear in the user determined highlight color on each
graph and the user can select F2 to display all of those particles in a View Window. Finally the user can
double-click on a filter to display the Collage Window of those particles.