- 45 -
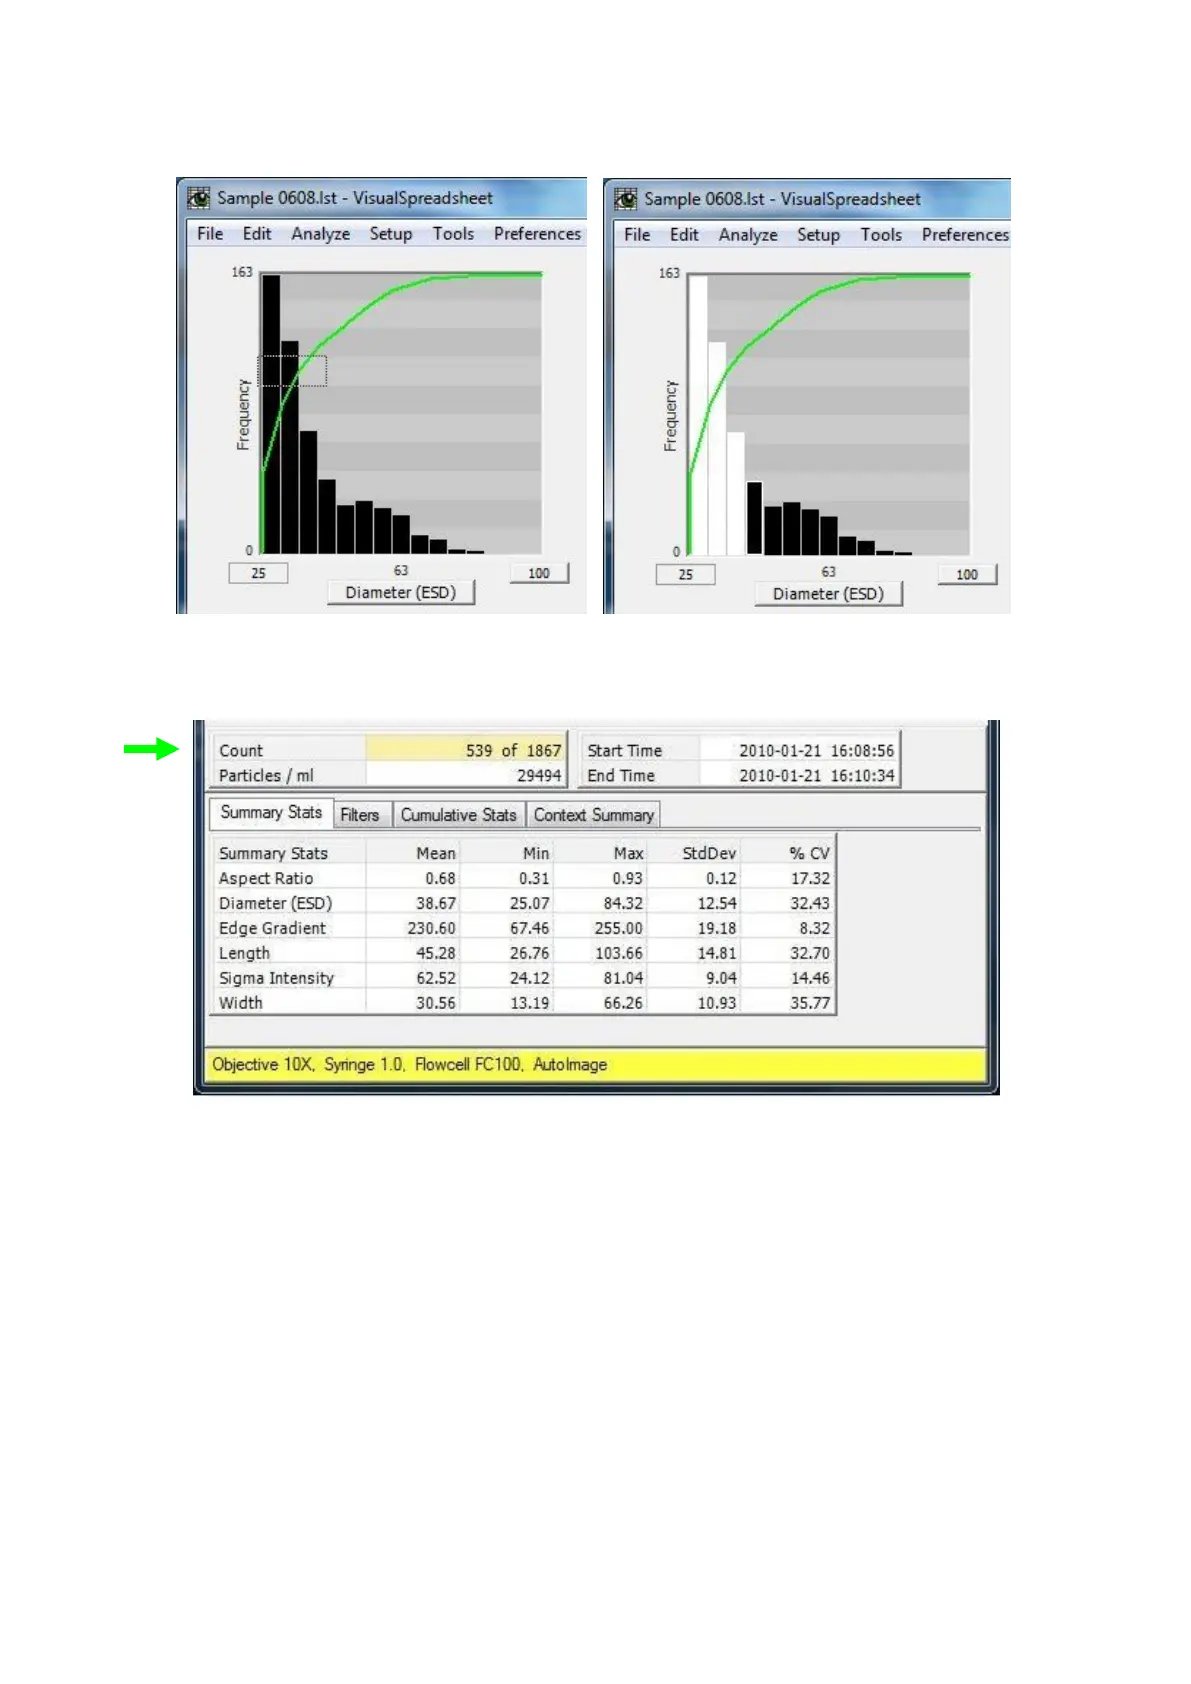
Figure 26. Example of how to select particles from a Bar Style Histogram
Figure 27. Highlighted Count area, since the entire data set is not displayed
Selecting Particles (Additional Information)
Bar Style Histograms: Drag the mouse horizontally to the right (or left) across the graph. The entire
vertical area of the graph is selected for the length of the horizontal line or rectangle selection area and
the particles in the selection area are shown in the View window.
Scattergram Plots: Left click and drag the mouse over the region of interest to create a rectangle
selection area. Particles within the selection rectangle are selected and shown in the View window.
Selecting the Entire Set of Particles: To select the entire region of either an Interactive Scattergram or
Histogram (all particle images), disable any current selection by clicking the left mouse button outside