- 81 -
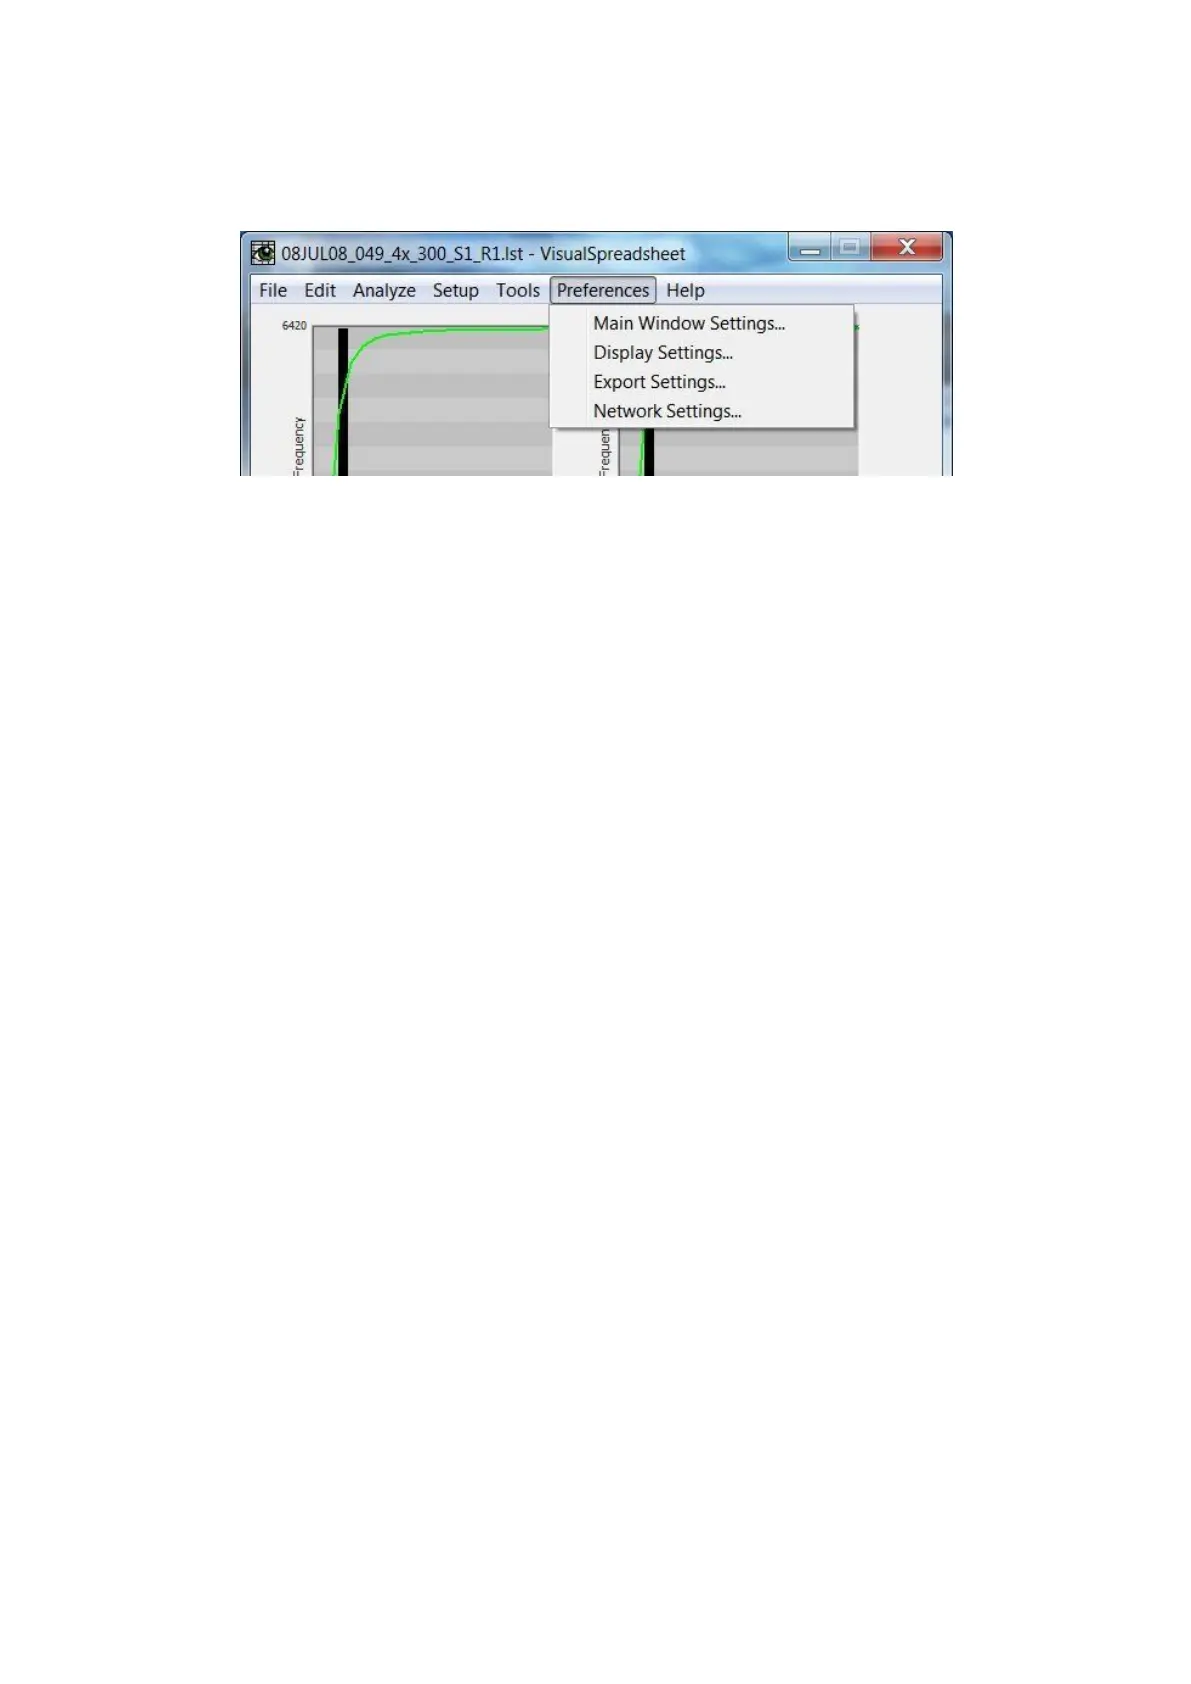
Preferences Menu
Main Window Settings… Layout
Graphs: The user can select one of seven options for the number and size of graphs to display on the
Main Window (from zero up to four small graphs).
Grids: This section contains six different options that can be selected by the user. When selected, the
appropriate information is displayed on the Main Window. The selections include:
· Show particle counts
· Show run start and end times
· Show summary statistics
· Show filters
· Show cumulative statistics
· Show context summary
Status Bar: Displays or hides the bar at the bottom of the Main Window.
Page Layout: The configuration of the Main window (as determined by the above selections) can be
saved as a template (denoted by a page layout file type of .plf) by using the Save Page Layout button.
During future use, the Load Page Layout button can be used to find and reload a previously saved
layout.
Main Window Settings… Graphs
Colors: The user can change the colors for various components of the graphs displayed on the Main
Window. These components include color choice for Scatter Plots, Histograms, cumulative line, and
graph background. To make a color choice, simply click the box containing the color to be changed.
Diameter Field: The user determines the Min Diameter and Max Diameter values for the X-Axis for
the graphs displayed on the Main Window that have the Diameter field plotted on the X-axis. The
Diameter values can be displayed using the ESD or the ABD Diameter Field.