136 INF-TN1FSC-E
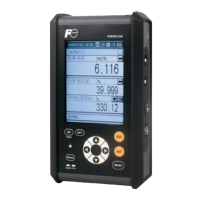
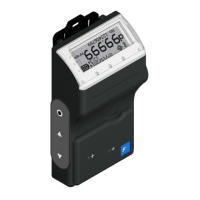
(2) How to observe fl ow velocity distribution screen
Typical fl ow velocity distribution measured using two sensors is shown below.
Displays the radius of fl ow velocity profi le by a single sensor.
Pipe inside wall
Graduation
interval
Flow velocity
distribution 2
Flow velocity
distribution 1
Pipe center
Displays mean fluid velocity or flow rate.
Status display in case of an error.
See "10.8 Contents of errors in status display"
in case of status display.
Pipe inside wall
Data of cursor position
Cursor
Quick logger
Logs fluid velocity data for an hour.
Start the logger upon start-up of display of
flow velocity distribution by [Source].
See "16.5.3 Flow velocity distribution data file"
located toward the end of the volume for the
recording format.
(How to observe Flow velocity distribution 1 and Flow velocity distribution 2)
[Source]: Select the sensor to be displayed.
Display of fl ow velocity distribution begins upon selection of a source.
[Dumping] The fl ow velocity distribution is displayed as averaged.
Instantaneous data is displayed, if 0 display is set.
[Cursor] Move the cursor using
, keys, and check the fl uid velocity data.
Case where the measuring range is set as radius F
Flow velocity distribution 1: Distribution in the radius in case a sensor is connected to the up-
stream side connector (Sensor U)
Flow velocity distribution 2: Distribution in the radius in case a sensor is connected to the
downstream side connector (Sensor D)
Case where the measuring range is set as radius N
Flow velocity distribution 1: Distribution in the radius in case a sensor is connected to the
downstream side connector (Sensor D)
Flow velocity distribution 2: Distribution in the radius in case a sensor is connected to the up-
stream side connector (Sensor U)
Case where the measuring range is set as diameter
Distribution is displayed by diameter in areas of Flow velocity distribution 1 and Flow velocity
distribution 2. (Sensor U, Sensor D or Sensor U/D)
Note) Measurement is normally taken in radius F.

 Loading...