5-2 PQM Power Quality Meter GE Power Management
5.2 A1 METERING 5 MONITORING
5
5.2 A1 METERING 5.2.1 CURRENT
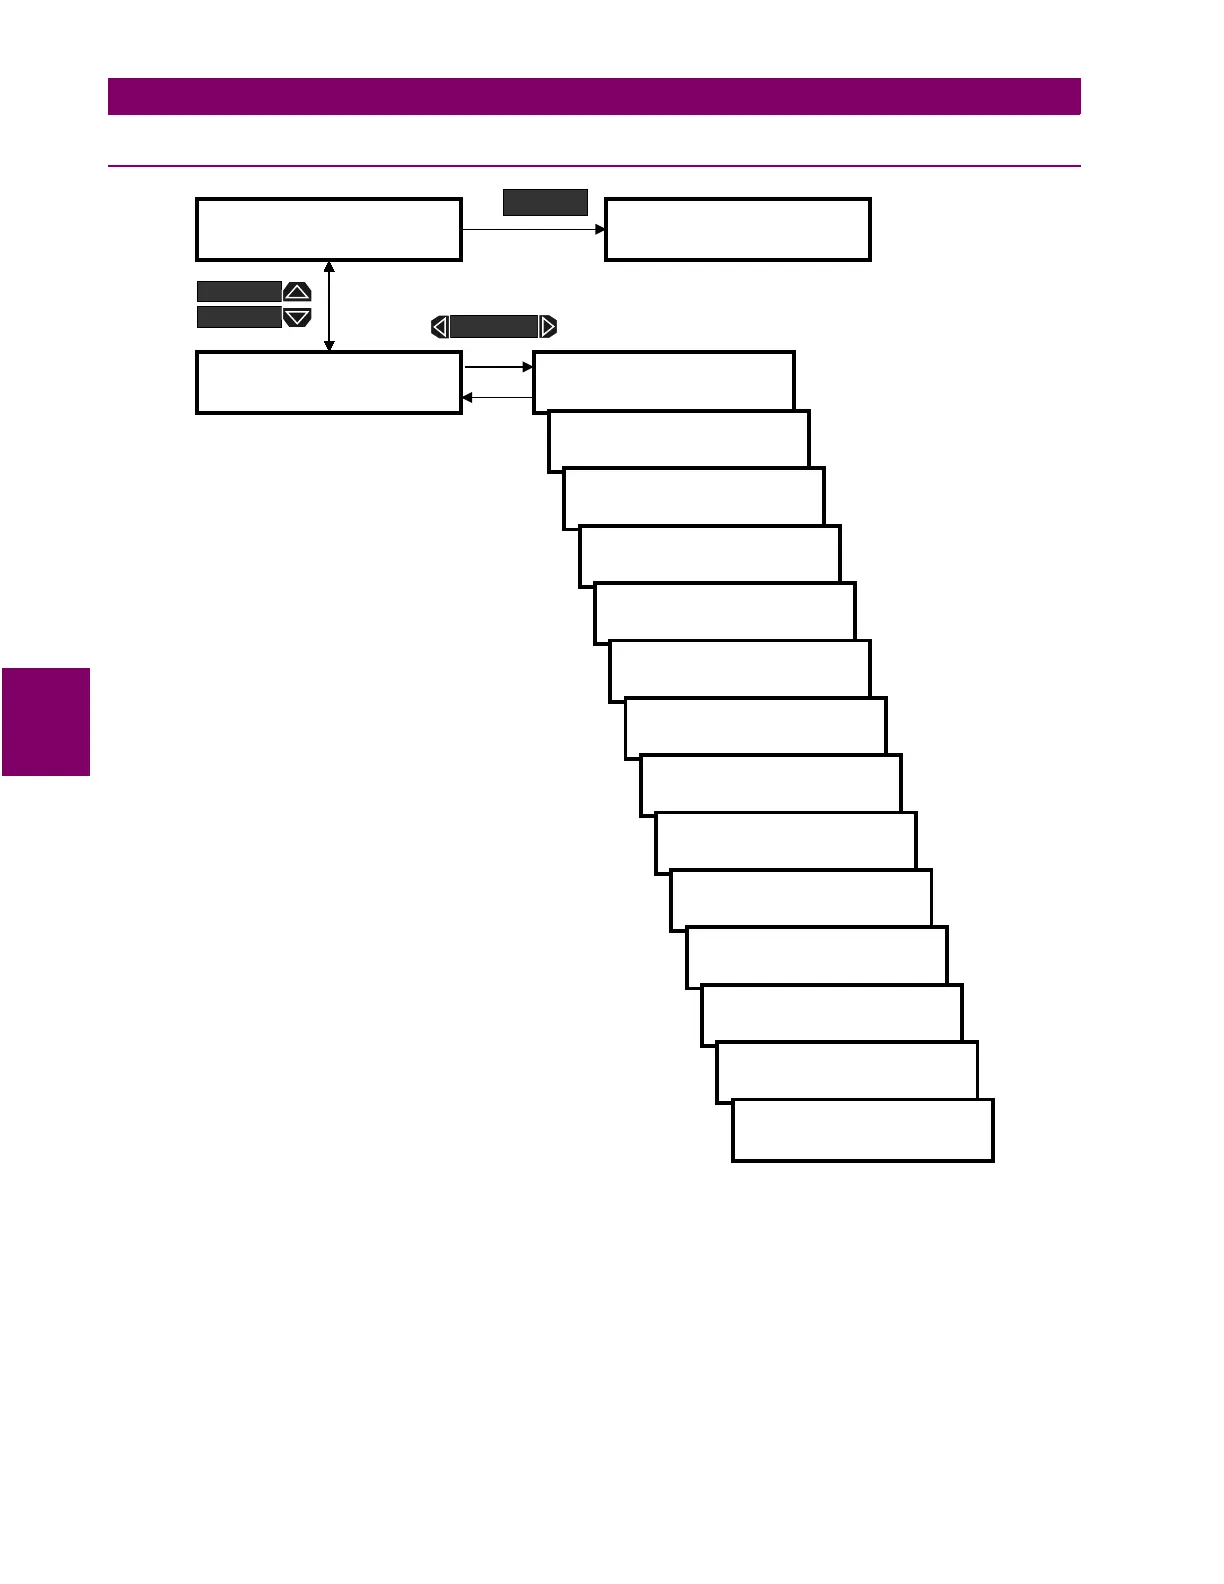
Figure 5–2: ACTUAL VALUES – METERING / CURRENT
A: B: C: CURRENT
: Displays the current in each phase corresponding to the A, B, and C phase inputs. Cur-
rent will be measured correctly only if the
CT PRIMARY
is entered to match the installed CT primary and the CT
secondary is wired to match the 1 or 5 A input. If the displayed current does not match the actual current,
check this setpoint and wiring.
Iavg/Vavg
:
Displays the average of the three phase currents and three voltages is displayed in this message.
This line is not visible if the
VT WIRING
setpoint is set to
SINGLE PHASE DIRECT
. L-N is displayed when
VT WIRING
is set to
4 WIRE WYE (3 VTs)
,
4 WIRE WYE DIRECT
,
4 WIRE WYE (2 VTs)
, or
3 WIRE DIRECT
. L-L is displayed when
VT
WIRING
is set to
3 WIRE DELTA (2 VTs)
.
]] ACTUAL VALUES
]] A1 METERING
] CURRENT
]
A = 100 B = 100
C = 100 AMPS
Iavg= 100 AMPS
Vavg= 120 V L-N
NEUTRAL CURRENT =
0 AMPS
CURRENT UNBALANCE =
0.0%
]] ACTUAL VALUES
]] A2 STATUS
ACTUAL
Ia MIN = 100 AMPS
12:00:00am 01/01/95
Ib MIN = 100 AMPS
12:00:00am 01/01/95
Ic MIN = 100 AMPS
12:00:00am 01/01/95
In MIN = 100 AMPS
12:00:00am 01/01/95
I U/B MIN = 0.0%
12:00:00am 01/01/95
Ia MAX = 100 AMPS
12:00:00am 01/01/95
Ib MAX = 100 AMPS
12:00:00am 01/01/95
Ic MAX = 100 AMPS
12:00:00am 01/01/95
In MAX = 100 AMPS
12:00:00am 01/01/95
I U/B MAX = 0.0%
12:00:00am 01/01/95
MESSAGE
MESSAGE
MESSAGE
 Loading...