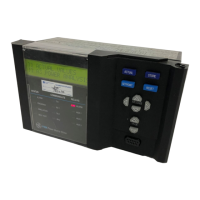
GE Power Management PQM Power Quality Meter A-15
APPENDIX A A.1 PQM APPLICATION NOTES
A
Log Date - Month: 06 15
Log Date - Year: 1997
Log Records Used: 1600
The last Record entry time is interpreted as 2:30 AM, 30.300 seconds, June 15, 1997. The Log Time Interval is
3600 seconds, or 1 hour. Taking the Log Records Used (1600) and multiplying this by the Log Time Inter-
val(3600) gives 5760000 seconds. This translates into 66 days and 16 hours. Subtracting backwards on a cal-
endar from the time for the last Record gives a time and date of 10:30:30.000AM, April 9, 1997. This is the time
stamp for the first Record. Time stamping the remaining Records requires adding 3600 seconds for each
Record starting from the time associated with the first Record. It is important to note that when in the Circulate
mode, and the Data Log fills the available memory, the Log wraps around the first available Register of the
memory structure and the Log Pointer to First Item of First Record will float along in time with each additional
entry into the Log. For example, if the Data Log has wrapped around the available memory more than once,
the Log Pointer to First Item of First Record will always be preceded in memory by the Log Pointer to First Item
of Record After Last. As each new entry is written into the Log, these two pointers move down to the next
record space in memory, overwriting the first entry into the log as of the Present Log Time and Date.
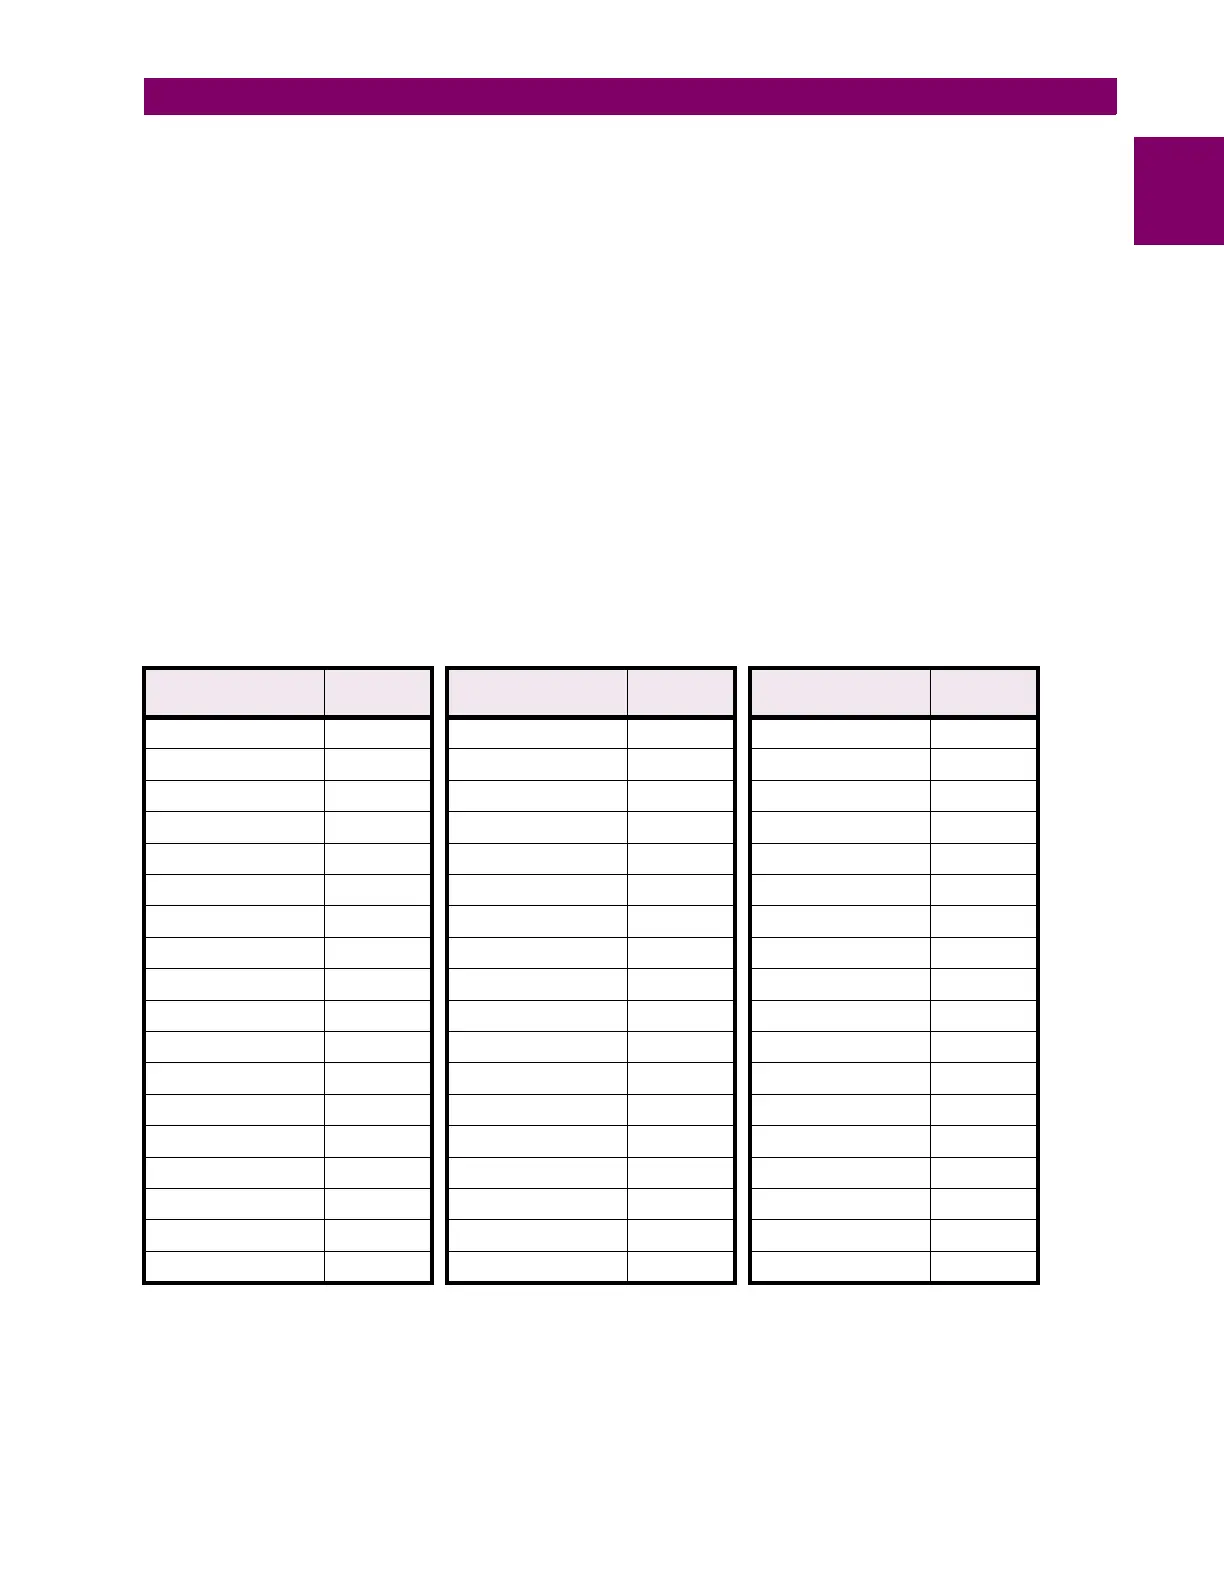
c) DATA LOG PARAMETERS
Listed below are the parameters available for capturing data via the Data Logger. Note that these parameters
will be placed within the Record structure of the Data Log in the order and size that they appear in this table.
where: I = current; V = Voltage; P = Real Power; Q = Reactive Power; S = Apparent Power; PF = Power Factor
THD = Total Harmonic Distortion
Table A–1: DATA LOG PARAMETERS
DATA LOG
PARAMETER
SIZE
(BYTES)
DATA LOG
PARAMETER
SIZE
(BYTES)
DATA LOG
PARAMETER
SIZE
(BYTES)
Ia 2PFa 2kVAh 4
Ib 2 Pb 4 Ia Demand 2
Ic 2 Qb 4 Ib Demand 2
Iavg 2 Sb 4 Ic Demand 2
In 2PFb 2In Demand2
I Unbalance 2 Pc 4 P3 Demand 4
Van 4 Qc 4 Q3 Demand 4
Vbn 4 Sc 4 S3 Demand 4
Vcn 4 PFc 2 Ia THD 2
Vpavg 4 P3 4 Ib THD 2
Vab 4 Q3 4 Ic THD 2
Vbc 4 S3 4 In THD 2
Vca 4 PF3 2 Van THD 2
Vlavg 4 Frequency 2 Vbn THD 2
V Unbalance 2 Positive kWh 4 Vcn THD 2
Pa 4 Negative kWh 4 Vab THD 2
Qa 4 Positive kvarh 4 Vbc THD 2
Sa 4 Negative kvarh 4 Analog Input 4
 Loading...