241
Detail program description - Telemetry
After selection of the desired menu line with the cd
selection keys of the left or right touch pad …
TELEMETRY
SETTING & DATAVIEW
SENSOR SELECT
RF STATUS VIEW
VOICE TRIGGER
TELEMETRY RCV
BIND. 1
VOLT.E
… and a subsequent tap on the center SET key of
the right touch pad will open the selected sub-menu.
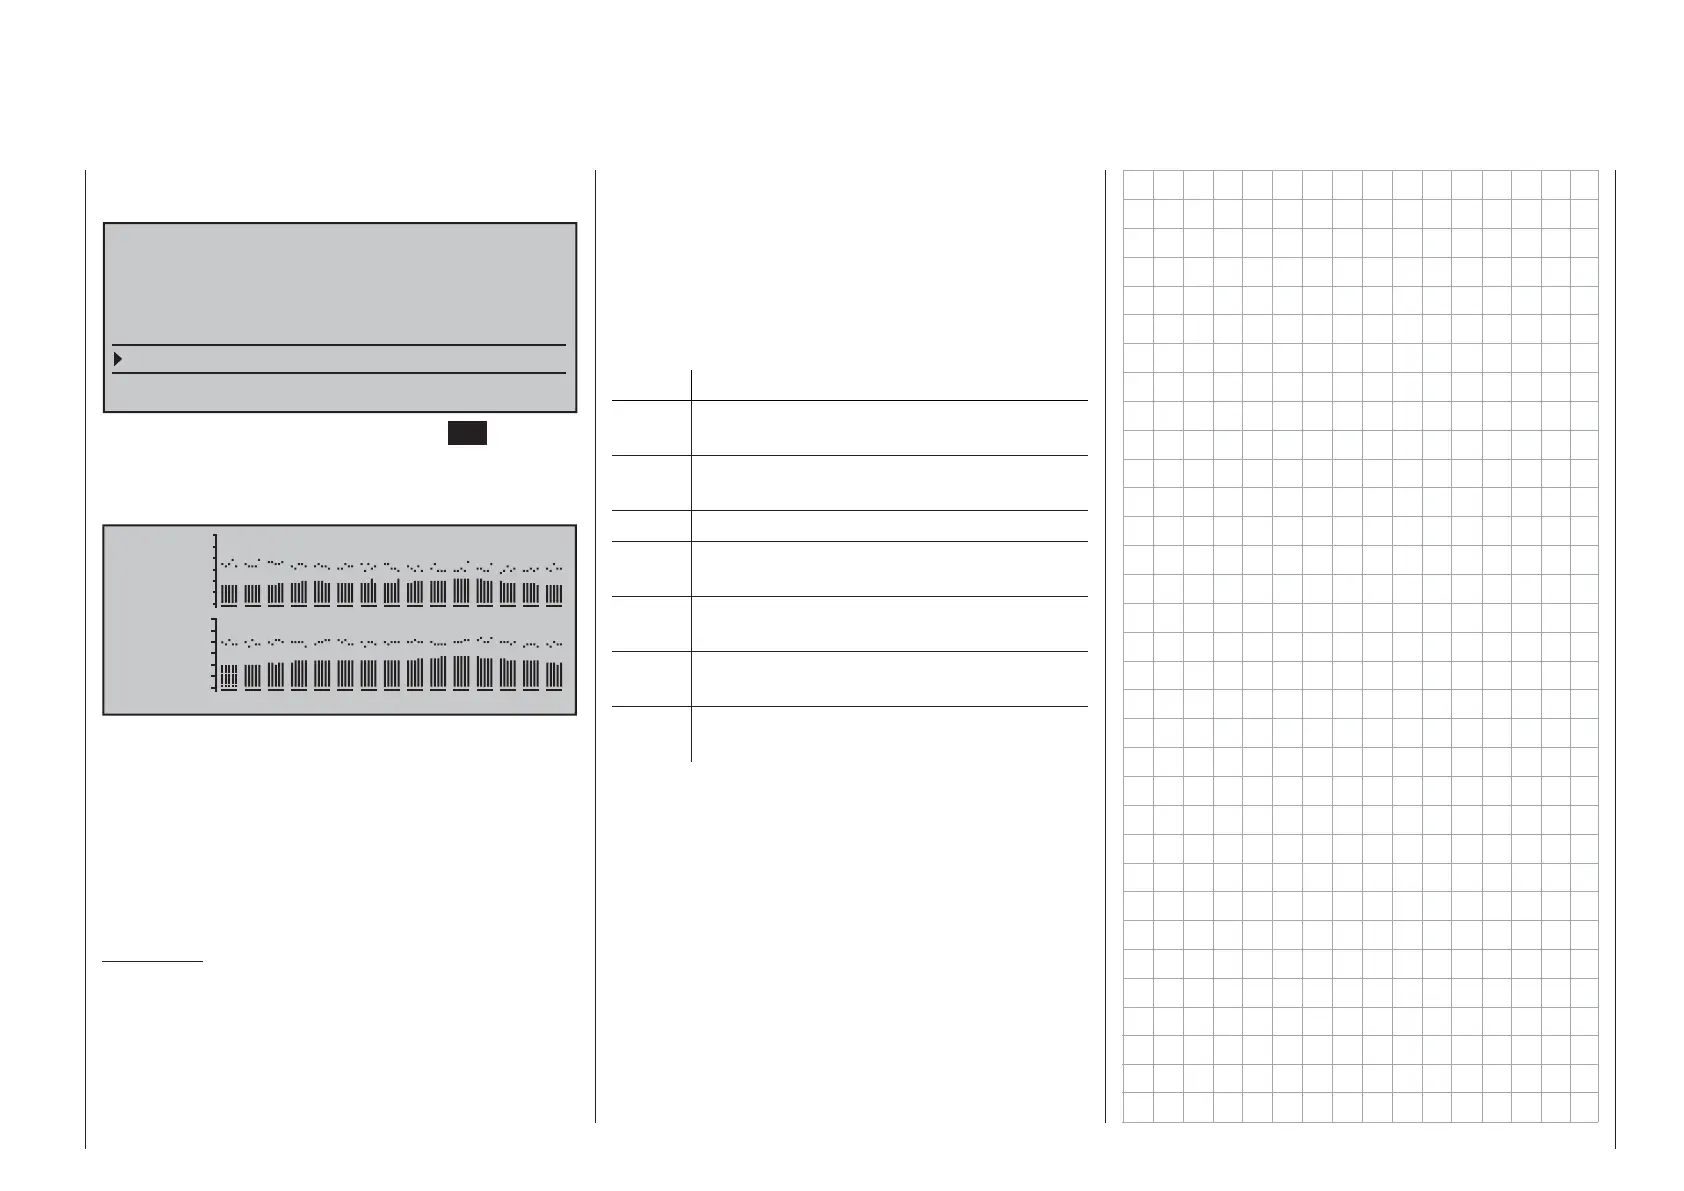
This provides a visualization of the quality of the
connection of transmitter and receiver:
E100%
SL 22
P 10
RL 41
4.8RS
S 95%
4.8RM
0 1 2 3 4 5 6 7 8 9 A B C D E
Top row: Reception power of the channels
1 … 75 of the 2.4 GHz band in dBm
coming from the receiver to the
transmitter.
Bottom row: Reception power of the channels
1 … 75 of the 2.4 GHz band in dBm
coming from the transmitter to the
receiver.
Comments:
Since reception power is measured and presented •
in dBm, reception power is increasingly worse
the higher the bar is and vice versa; refer also to
"Reception power (S-dBm)" on page 230 about
RF STATUS VIEW
this.
The points above the bars mark the poorest •
reception since switching on the transmitter or
the last reset of the display with a simultaneous
tap on thecd or ef keys of the right touch pad
(CLEAR).
Additional fi gures are shown to the left of the graphic
representation of the reception power. These mean:
Value Explanation
E Signal quality in % of the signal received
from the receiver
S Signal quality in % of the signal received
by the receiver
SL Reception power in dBm
P Number of lost data packages of the
receiver
RL Reception power in dBM of the signal
received by the receiver
RS Current operating voltage of the receiver
in volts
RM Lowest receiver operating voltage since
last startup, in volts
 Loading...