PC Application
User’s Manual 36
You can change the grid and waveform color intensity in this dialog.
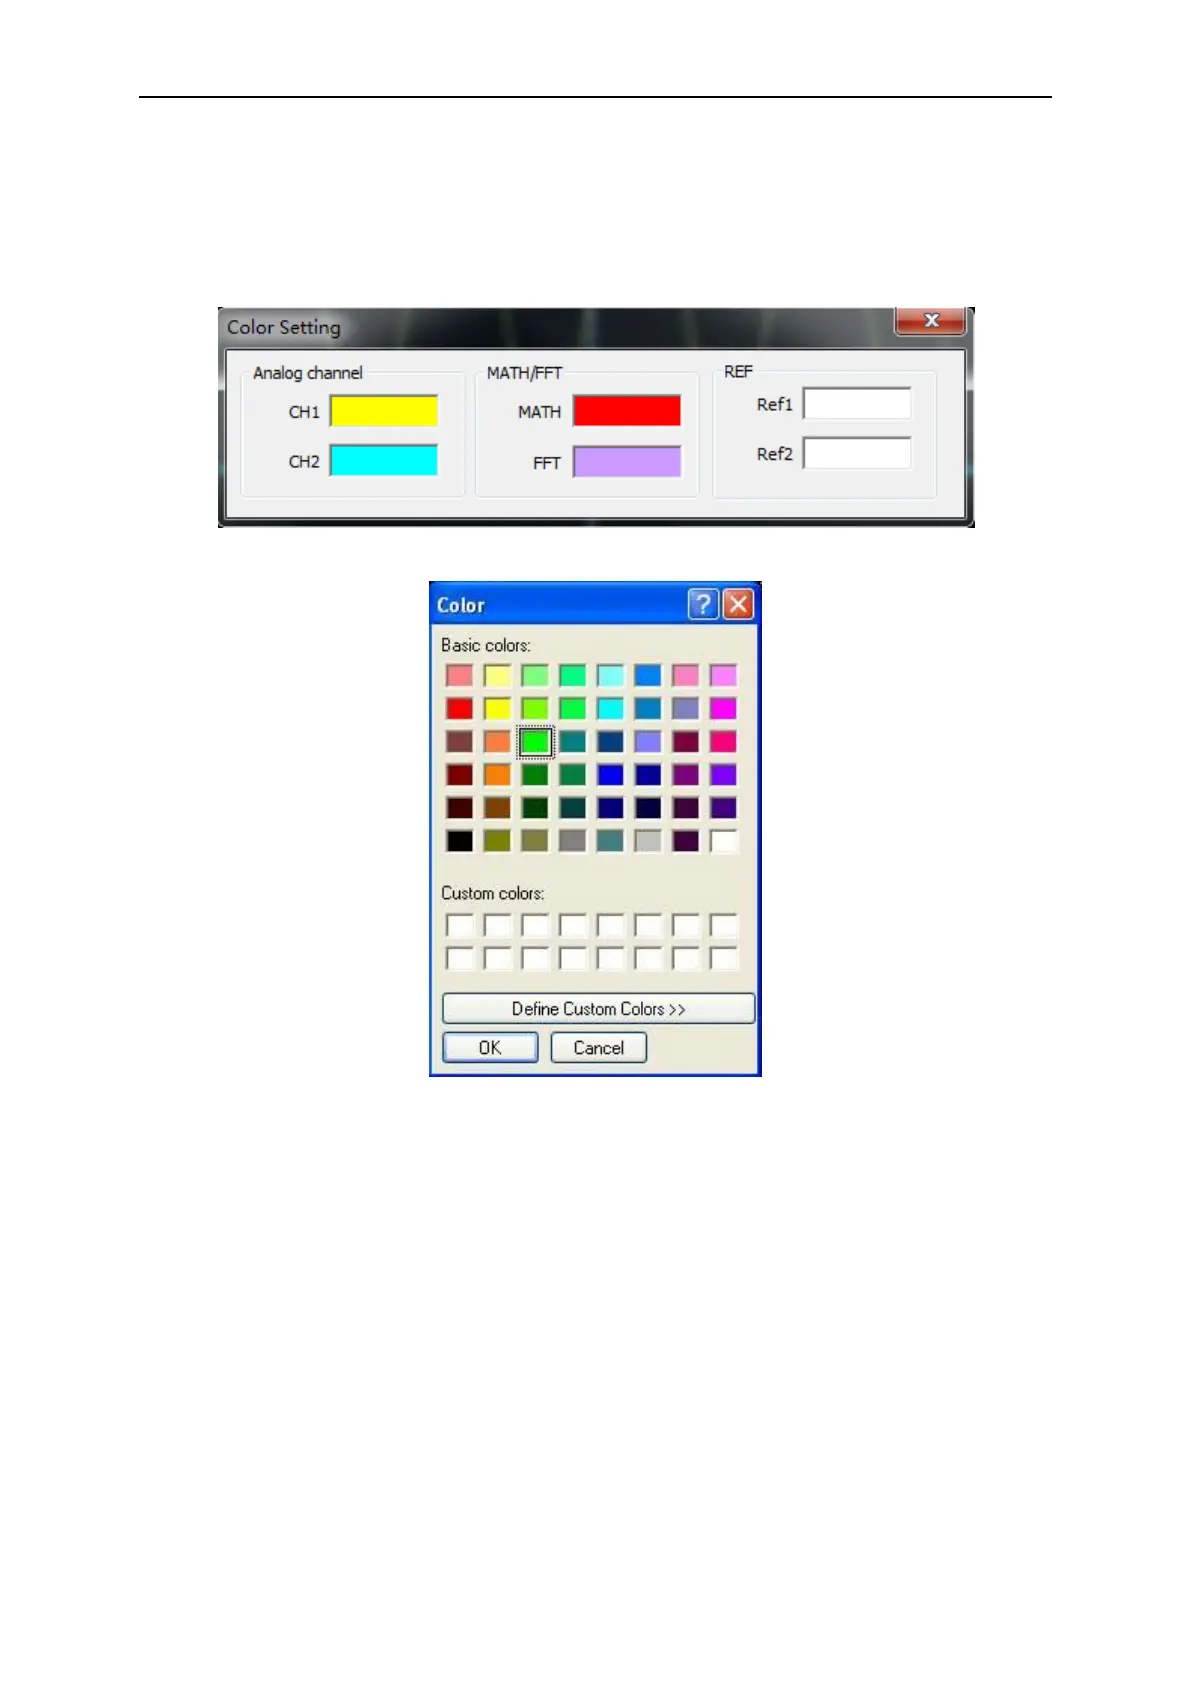
Wave Color
Click “Display->Wave Color” in main menu.
The following figure shows the waveform color dialog. It shows the waveform color setting.
If you click the color rectangle, the color dialog will be showed:
2.13 Measure System
The oscilloscope displays graphs of voltage versus time and can help to measure the displayed
waveform. There are several ways to take measurements, using the graticule, cursor
measurement or performing an automatic measurement.
2.13.1 Scale measurement
Graticule: This method allows you to make a quick, visual estimate and take a simple
measurement through the graticule divisions and the scale factor.
For example, you can take simple measurements by counting the major and minor graticule
divisions involved and multiplying by the scale factor. If you counted 6 major vertical graticule
divisions between the minimum and maximum values of a waveform and knew you had a scale
 Loading...