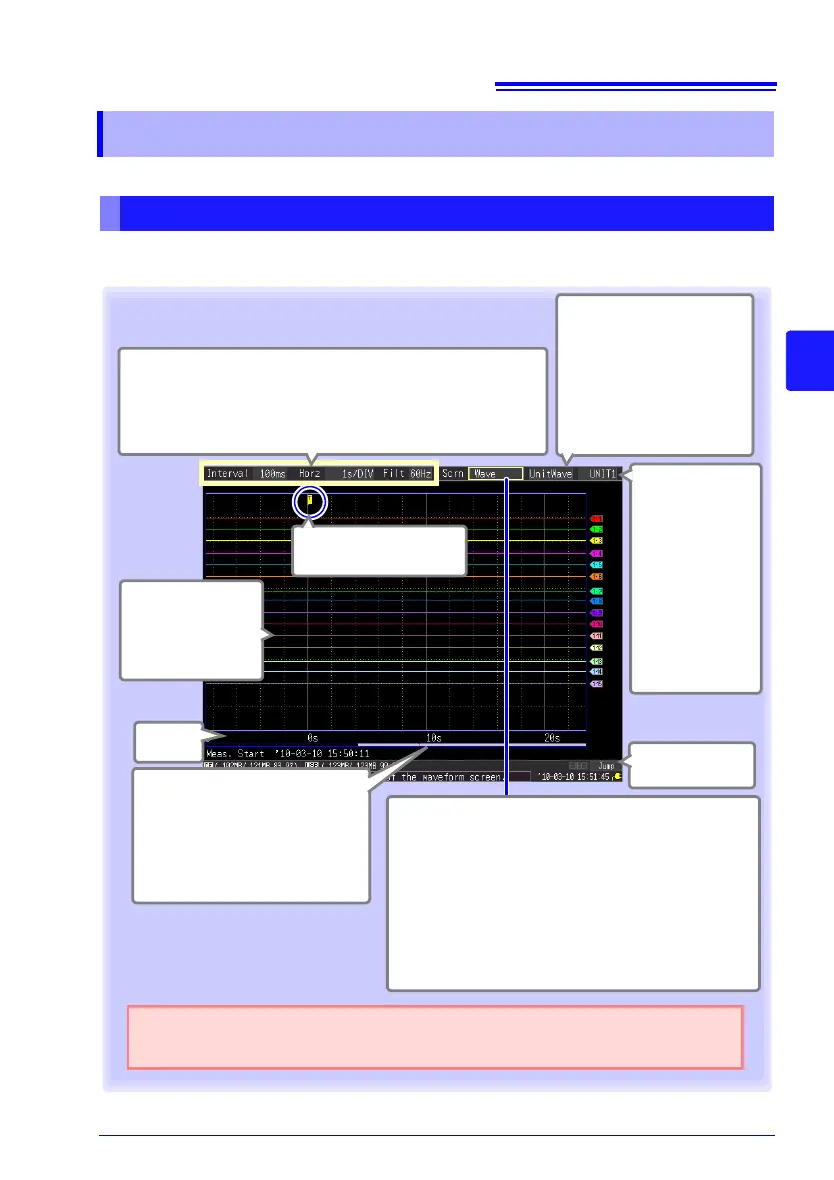
presses cycle the screen through seven types (p. 19).
Analog, pulse,
and logic wave-
forms
Displays acquired
data as waveforms.
Trigger Mark
Indicates a trigger event
Jump Function
(p. 89)
Time
Values
Settings can be changed.
(See indicated page for details)
• Recording interval (data acquisition interval) (p. 50)
• Display time base (time per horizontal division) (p. 68)
• Digital filtering (noise suppression) (p. 73)
All Waveforms/Unit
Waveforms
[All Wave]
Displays the waveforms for all
channels enabled for mea-
surement (On).
[UnitWave]
Displays the waveforms of
each input unit.
UNIT1
W30
Select the input
unit with the wave-
forms to view when
[UnitWave] is se-
lected.
Press UNIT to
switch input units.
Input units can be
switched in jumps
as described be-
low.
Screen Example: [Wave] display
( : default setting)
Scroll Bar
Shows the range and position of the
displayed waveform.
Viewing the Scroll bar (p. 88)
Information such as measurement
start time and start trigger times is
displayed below the scroll bar.
The screen display span also be changed here.
(
[Gauge+Wave ])
• A gauge can be displayed for each channel, and channel
settings can be changed (p. 86).
• Measurement data can be displayed as waveforms and
numerical values, as numerical values with comments, or
as numerical values only (p. 87).
• Numerical values at waveform cursor positions can be
viewed (p. 91)
• Numerical calculation results can be displayed (p. 143)
Unit 1 (1-1 to 15)Unit 2 (2-1 to 15)Unit 3 (3-1 to 15)Unit 4 (4-1 to 15)Pulse/
Alarm (P1 to P8), (ALM1 to ALM4)Waveform Calculation 1 (W1 to 15)Waveform
Calculation 2 (W16 to 30)returned to Unit 1 (1-1 to 15)