7.4 Displaying Harmonic Trends
108
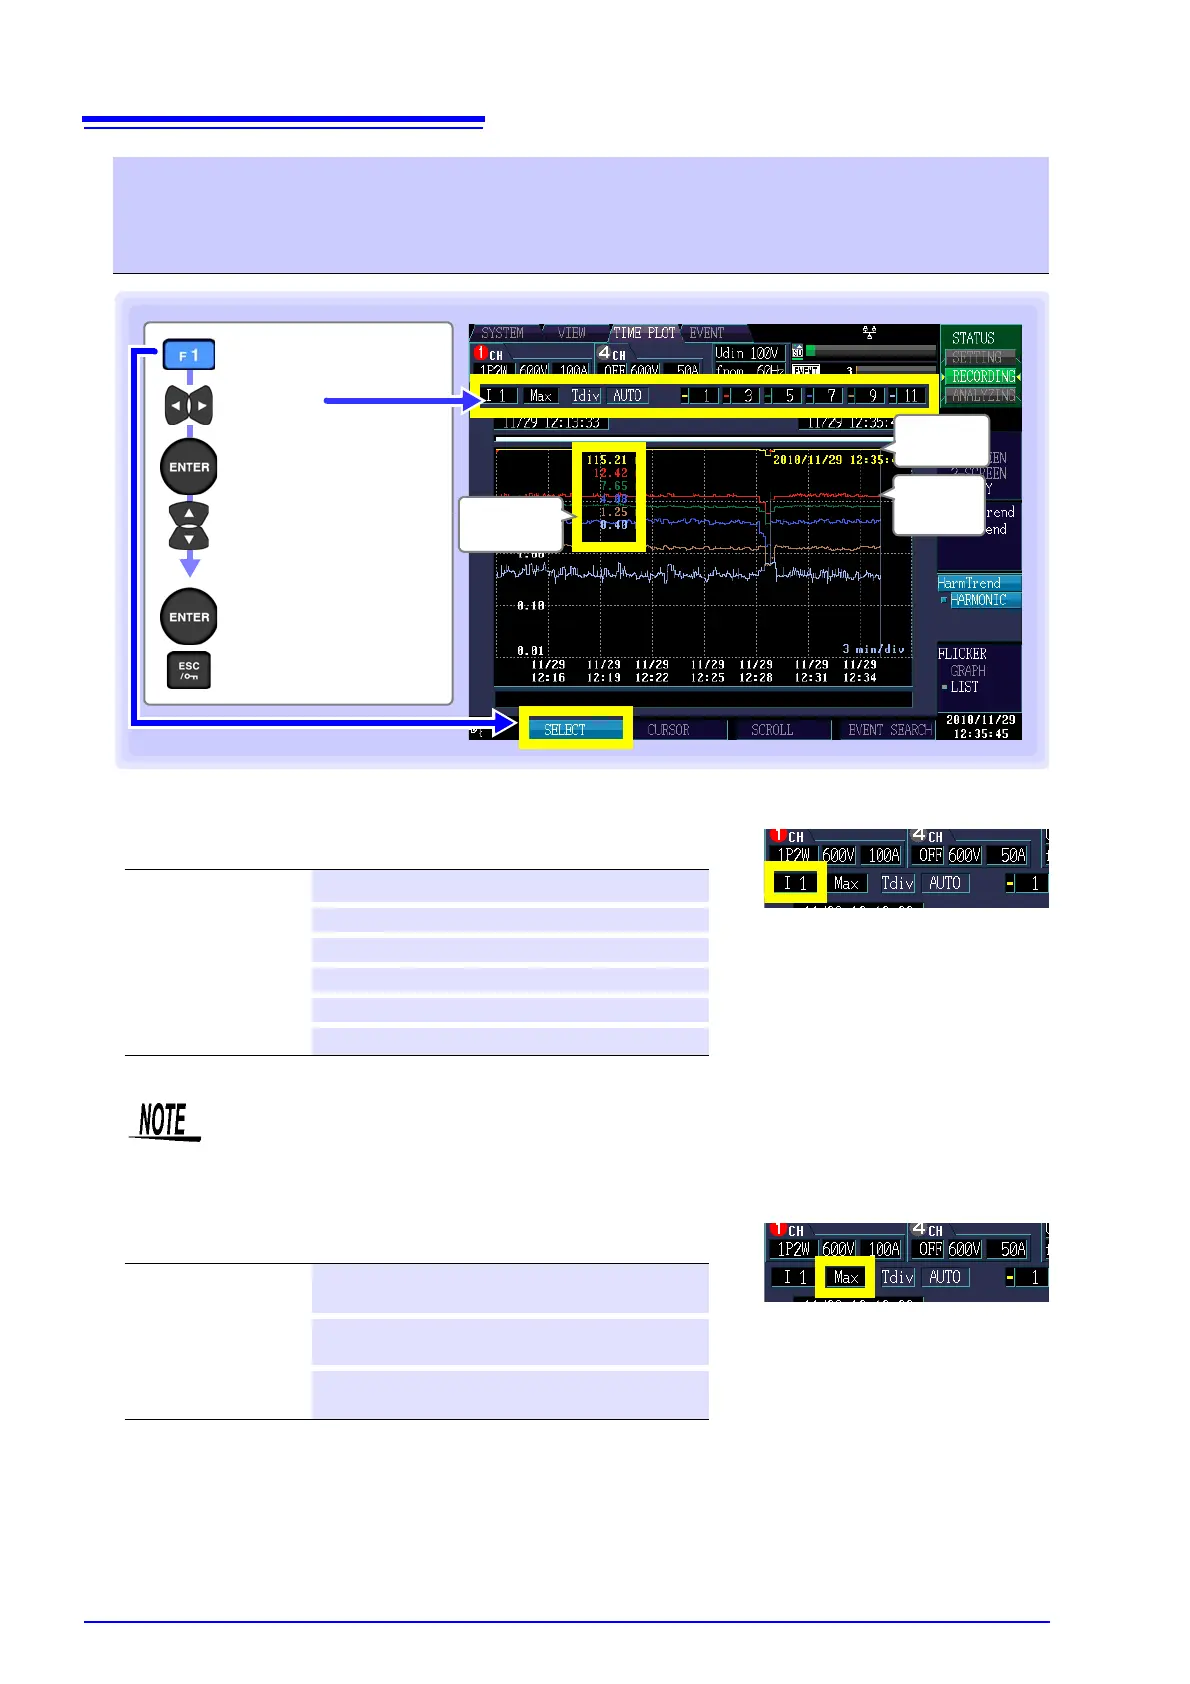
Displayed items
The available displayed characteristics options vary with the connection method.
Displayed waveforms, displayed measured values
Changing displayed items, displayed waveforms, and displayed mea-
sured values; enlarging and reducing graphs (changing the X-axis
scale); and changing the displayed order
Display the
pull-down menu
Select a setting
Accept the setting
Cancel
[SELECT]
Select
Measured
values
1st-order
waveform
3rd-order
waveform
Settings:( : Default)
U1/U2/U3/U4
Voltage (CH1/2/3/4)
I1/I2/I3/I4
Current (CH1/2/3/4)
P1/P2/P3
Active power (CH1/2/3)
Psum
Total active power
1/2/3
Phase difference (P phase) (CH1/2/3)
sum
Total phase difference (P phase)
Only U1/U2/U3/U4/I1/I2/I3/I4 can be selected for the inter-harmonic time series graph.
Settings:( : Default)
MAX
Displays the maximum value during the TIME-
PLOT interval.
MIN
Displays the minimum value during the TIME-
PLOT interval.
AVG
Displays the average value during the TIME-
PLOT interval.

 Loading...


