7.4 Displaying Harmonic Trends
109
Chapter 7 Monitoring Fluctuations in Measured Val-
7
X-axis scale (Tdiv)
Selects the X-axis scale.
AUTO scaling is used during recording. This cannot be
Displayed Order
Six orders can be selected and displayed at the same time. The measured value and waveform are dis-
played using the color of the order at the left.
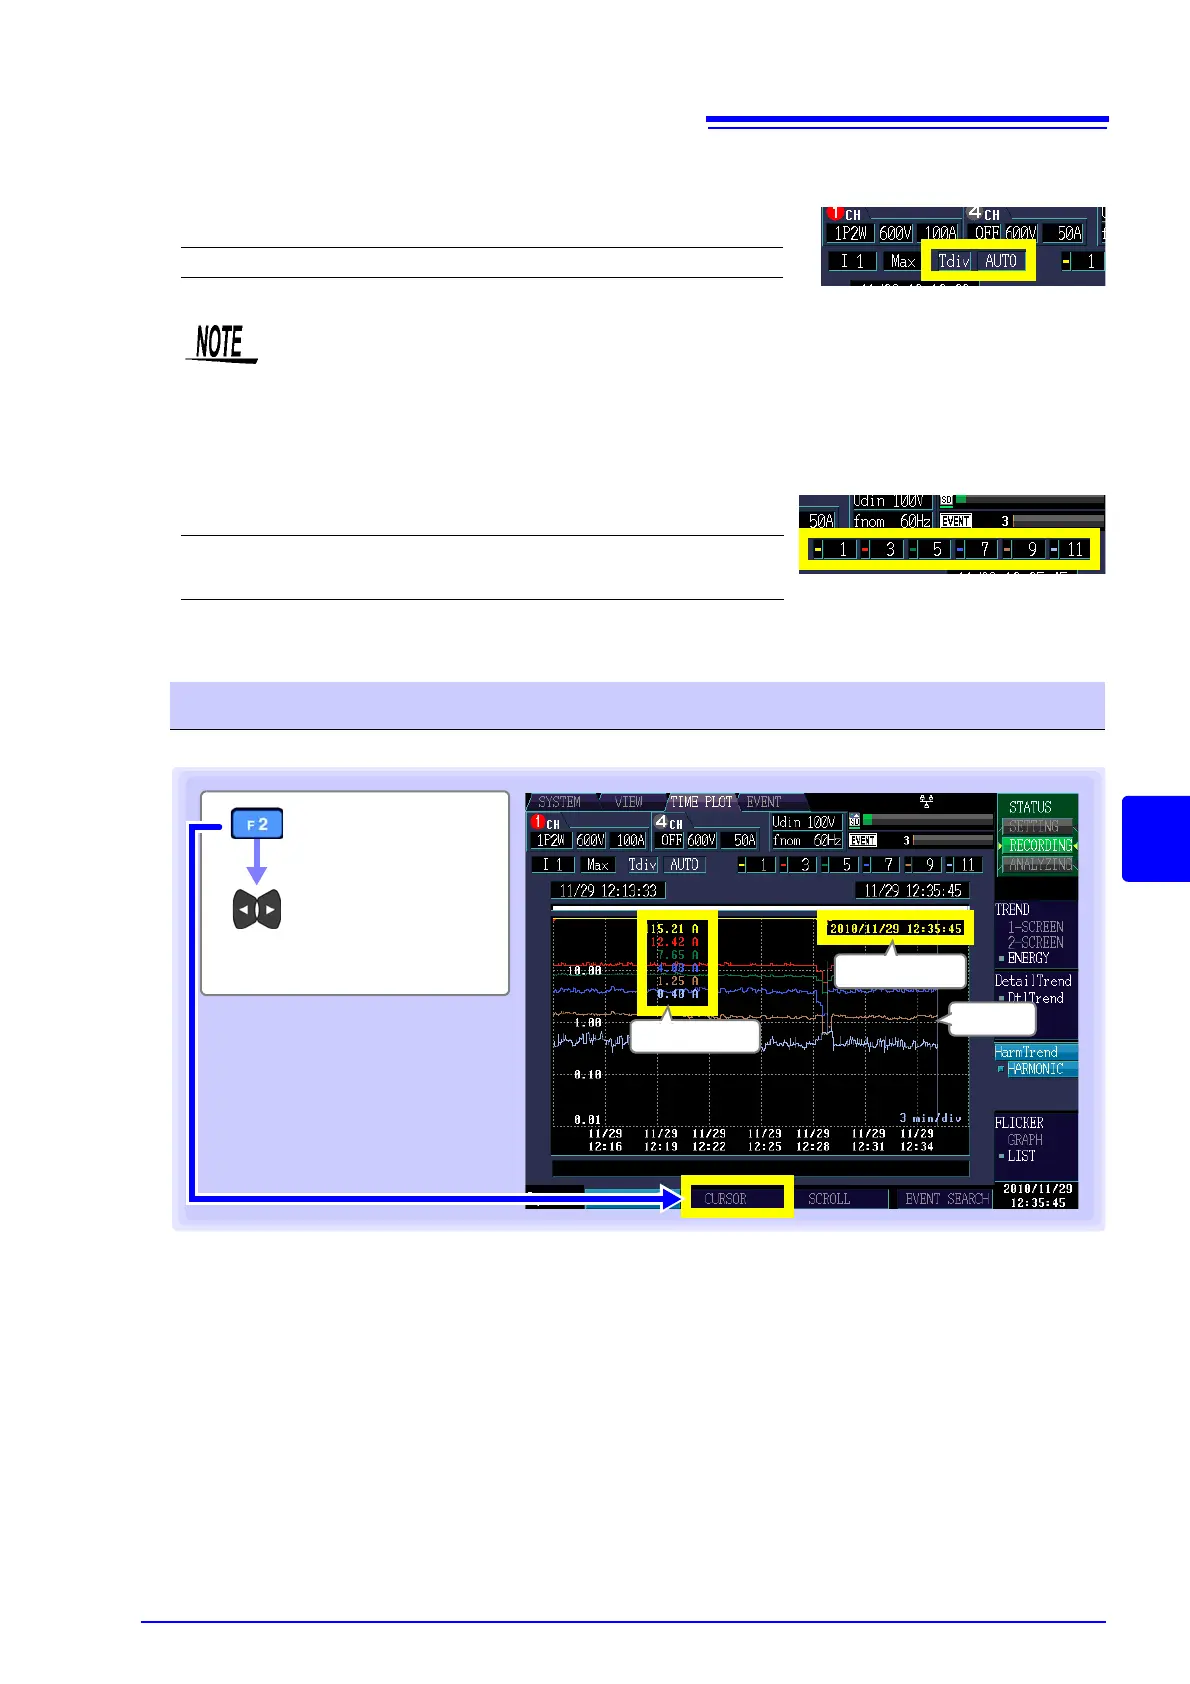
This section describes how to read the value and time above the time series graph cursor.
Settings:
From 1min/div
The Y-axis scale cannot be changed. The Y-axis maximum value will be the same as the
range’s full-scale value.
Settings:( : Default)
(1,3,5,7,9,11), 0 to 50 ([HARMONIC] screen)
(1.5,3.5,5.5,7.5,9.5,11.5)
, 0.5 to 49.5 ([INTERHARM] screen)
Reading the value above the cursor (Cursor measurements)
[CURSOR]
Move the vertical
cursor left and
right to read the
display value.
The cursor value is shown in
the same color as the
selected order.
Cursor
Cursor time
Cursor value

 Loading...