7.4 Displaying Harmonic Trends
110
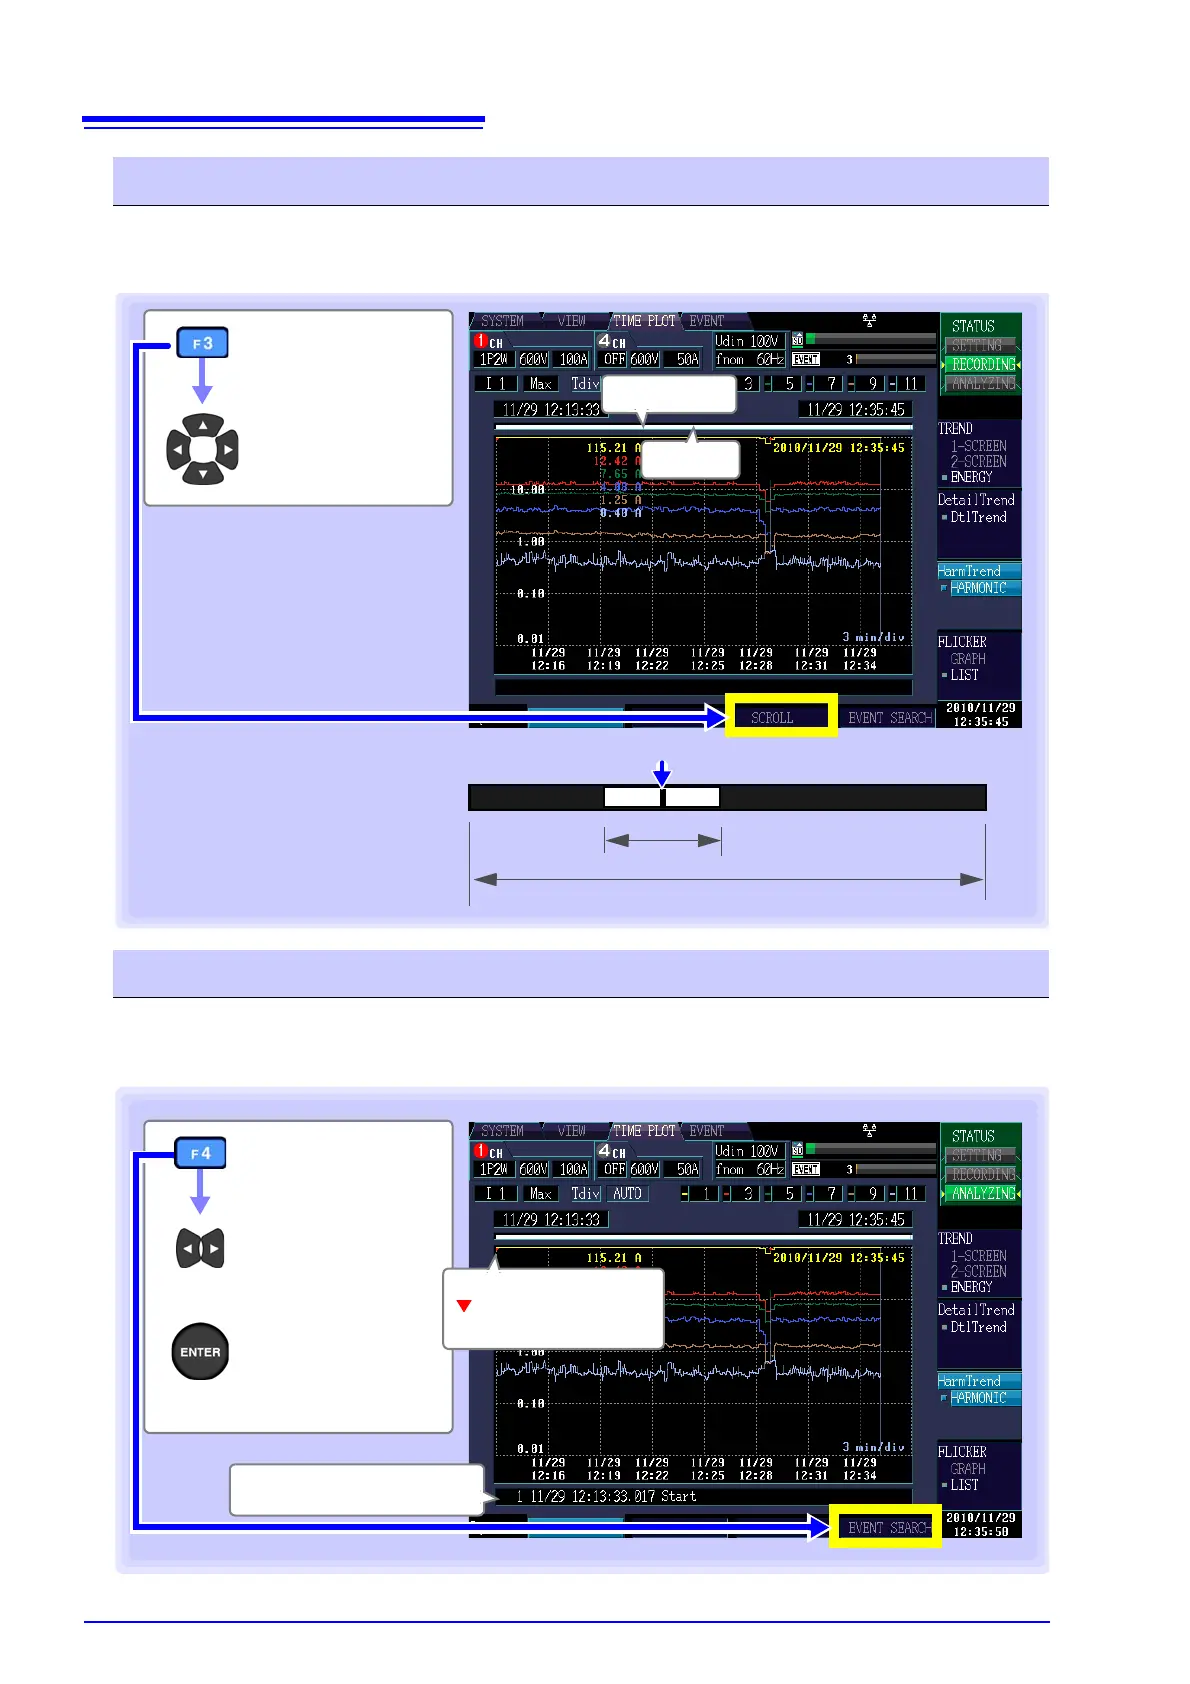
During recording, the X-axis is automatically scaled so that the full time series graph fits on the screen.
Once recording has stopped and the X-axis scale has been changed so that the waveforms do not fit on
the screen, you can scroll through the time series graph by moving left and right.
You can search for the time the event occurred (event marker).
The start time and stop time event markers are always displayed.
Synchronization is achieved with an event selected from the event list.
Scrolling through waveforms
[SCROLL]
Scroll through the
graph
Scroll bar
Scroll bar
Display scope
All measurement data
• The white band on the scroll bar indicates
the range of measured values that can be
displayed. When this band does not include
the cursor position, the cursor and cursor
value are not displayed.
• The cursor on the scroll bar shows where
the cursor is located relative to all measure-
ment data.
Display scope
Cursor position
Searching for events
[EVENT SEARCH]
Skips sideways
through the event
markers.
Event mark
(Red):
Indicates a normal event.
Analyzing events
using waveforms
Event number, time and date,
type, channel