7.5 Displaying Flicker Values in Graph and List Form
113
Chapter 7 Monitoring Fluctuations in Measured Val-
7
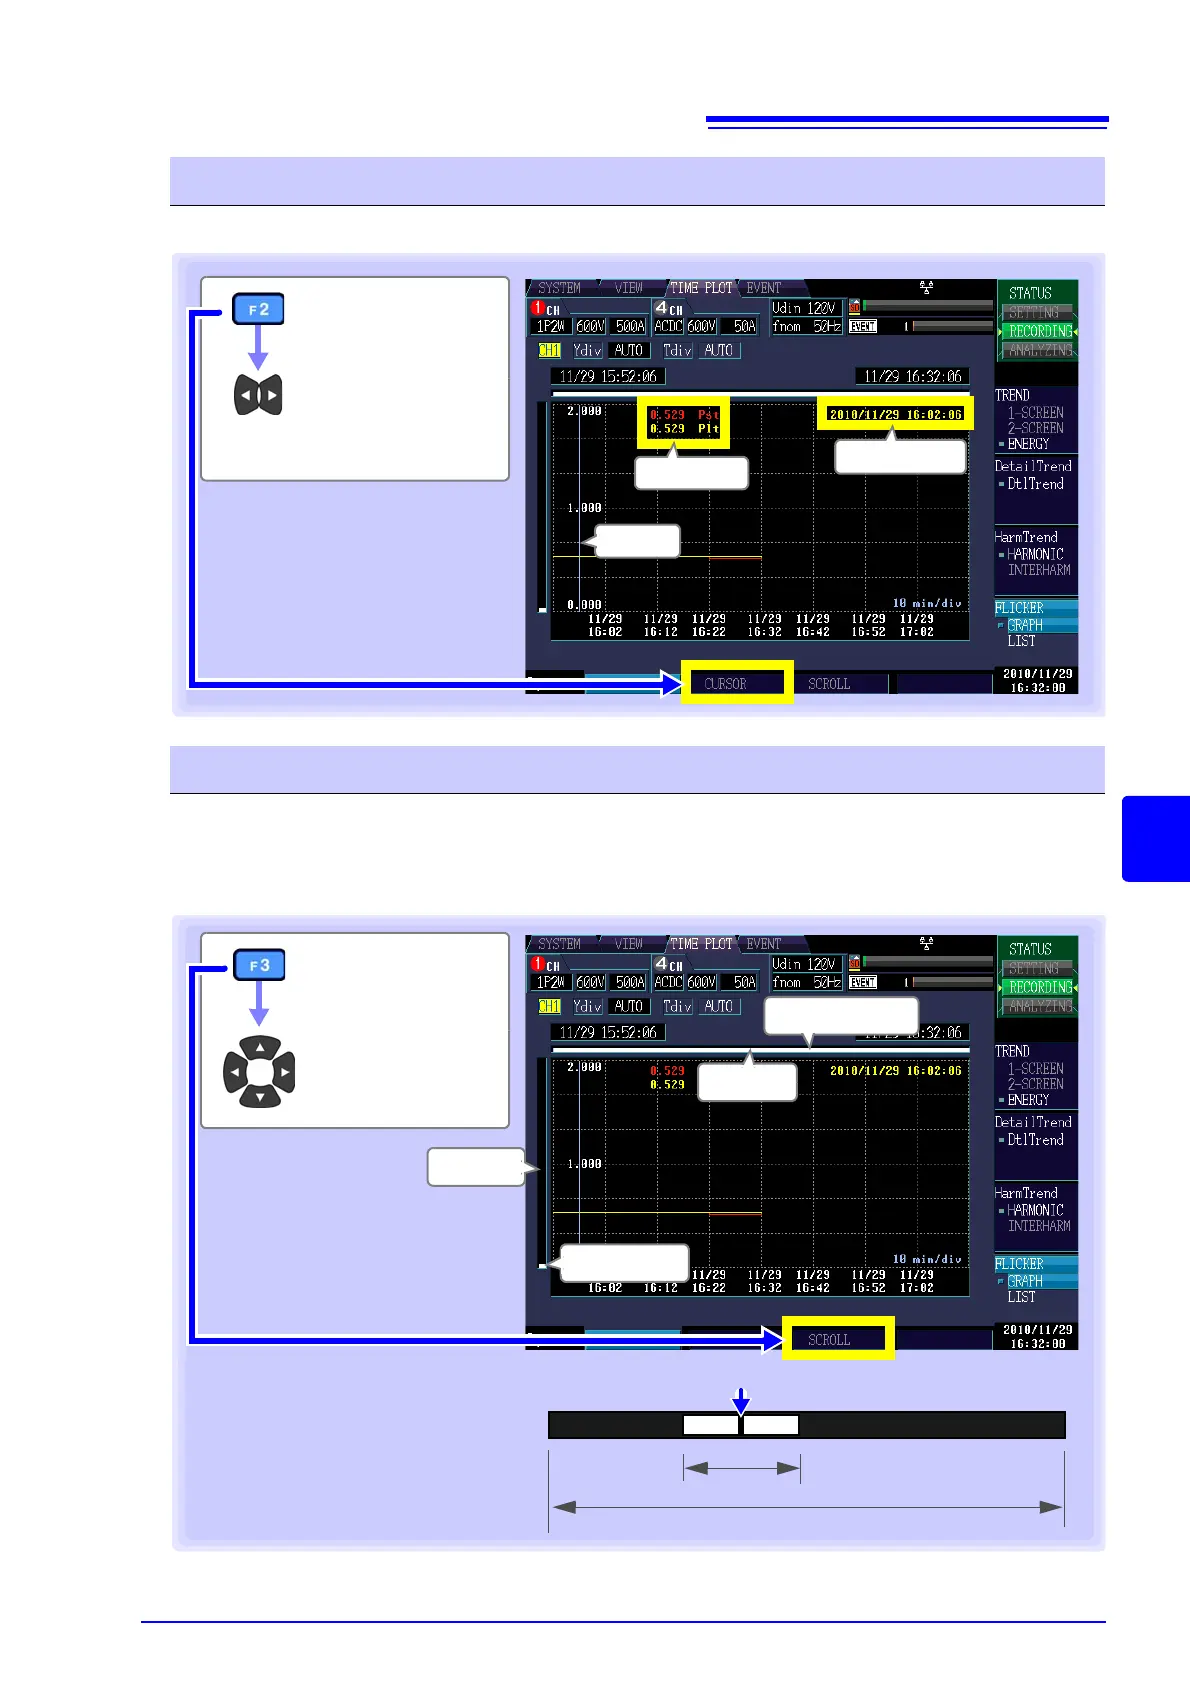
This section describes how to read the Pst and Plt measured values every 10 minutes.
During recording, the X- and Y-axis are automatically scaled so that the full time series graph fits on the
screen. Once recording has stopped and the X- and Y-axis scale has been changed so that the wave-
forms do not fit on the screen, you can scroll through the time series graph by moving left, right, up, and
down.
Reading the value above the cursor (Cursor measurements)
[CURSOR]
Move the vertical
cursor left and
right to read the
display value.
Cursor value
Top: Pst measured value
Bottom: Plt measured value
Cursor
Cursor time
Cursor value
Scrolling through waveforms
[SCROLL]
Scroll through the
graph
Scroll bar
Display scope
Scroll bar
Display scope
Scroll bar
Display scope
All measurement data
Cursor position
• The display scope on the scroll bar
(shown in white) illustrates which
range of all measurement data is
being shown on the screen.
• The cursor on the scroll bar shows
where the cursor is located relative to
all measurement data.

 Loading...


