6.2 Displaying Instantaneous Waveforms
77
Chapter 6 Monitoring Instantaneous Values (VIEW
6
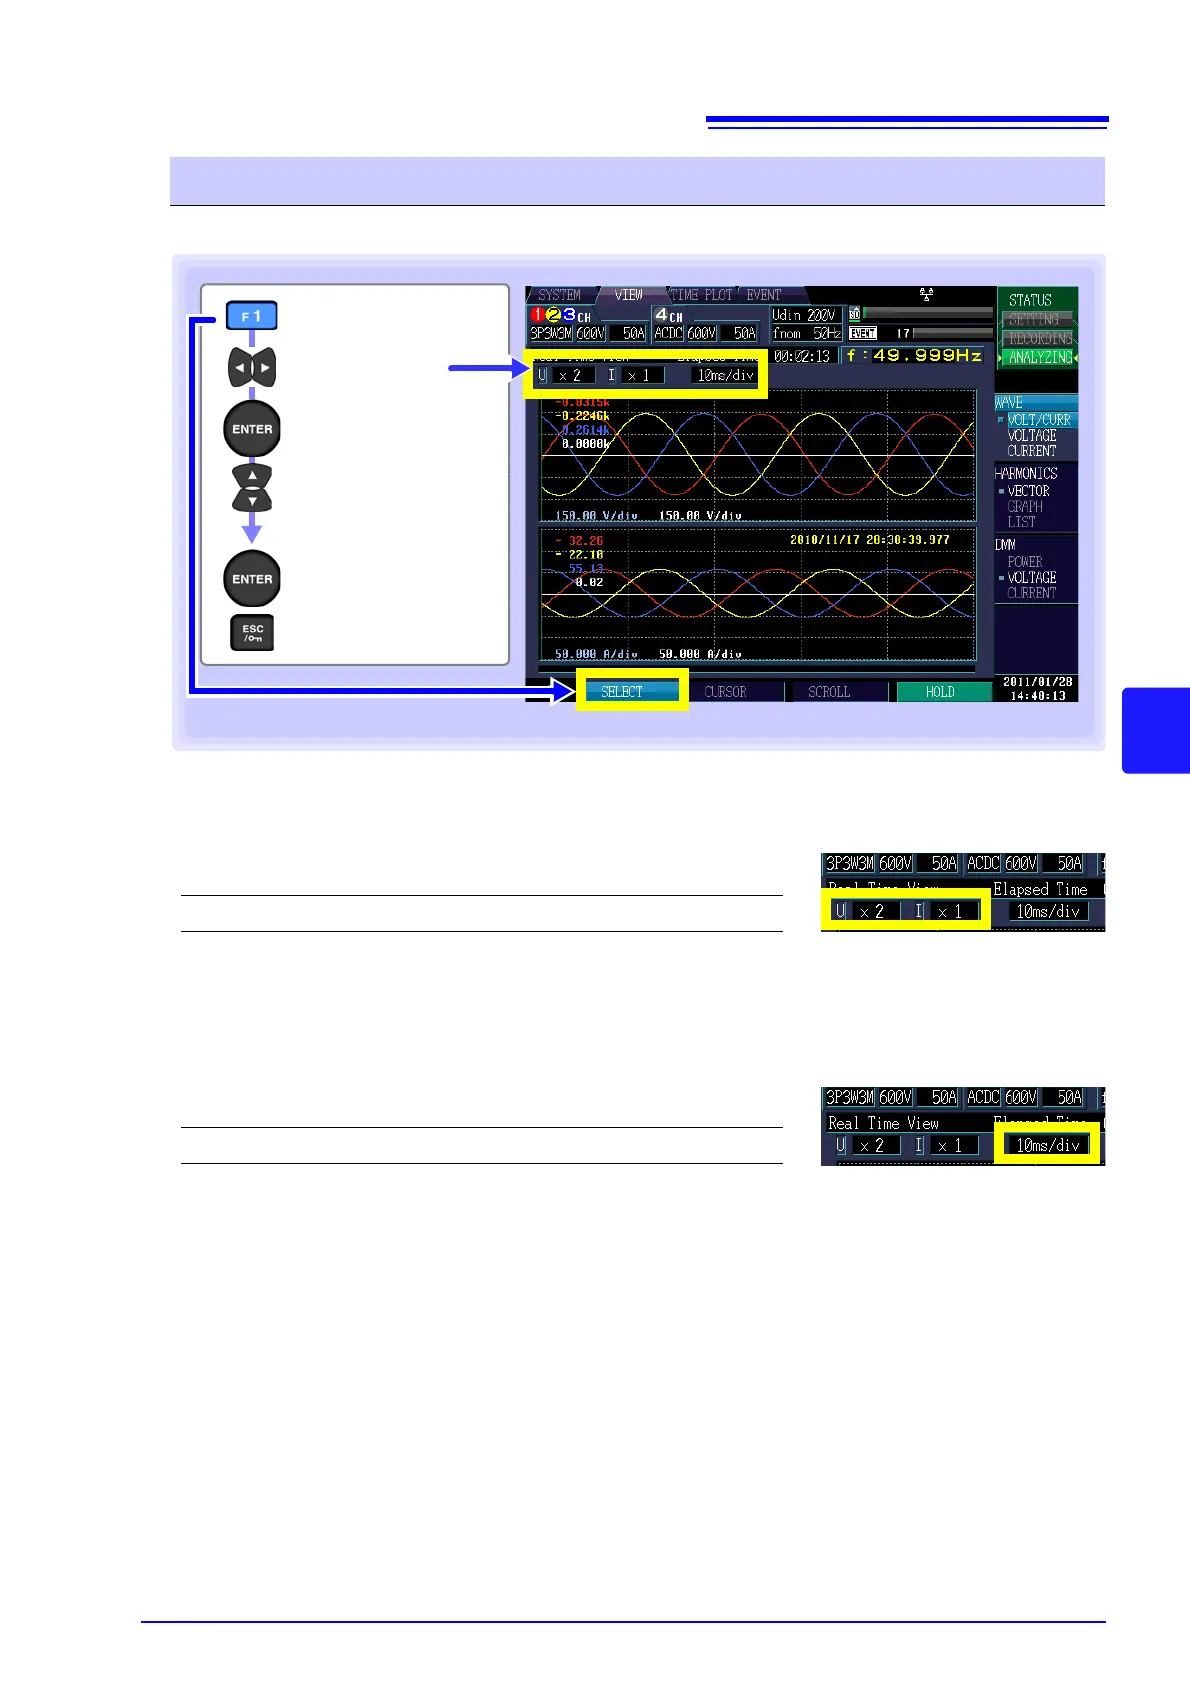
Y-axis scale (U: Voltage, I: Current)
To reduce the graph, decrease the scale.
To enlarge the graph, increase the scale.
The scale can also be changed without using the pull-down menu by
pressing the up and down cursor keys.
X-axis scale
To reduce the graph, decrease the scale.
To enlarge the graph, increase the scale.
The scale can also be changed without using the pull-down menu by
pressing the up and down cursor keys.
Reduce or enlarge the waveform (changing the X- and Y-axis scale)
Display the
pull-down menu
Select the setting
Accept setting
Cancel
[SELECT]
Select the set-
ting
Settings:( : Default)
x1/3, x1/2, x1, x2, x5, x10, x20, x50
Settings:( : Default)
5ms/div, 10ms/div, 20ms/div, 40ms/div