6.2 Displaying Instantaneous Waveforms
79
Chapter 6 Monitoring Instantaneous Values (VIEW
6
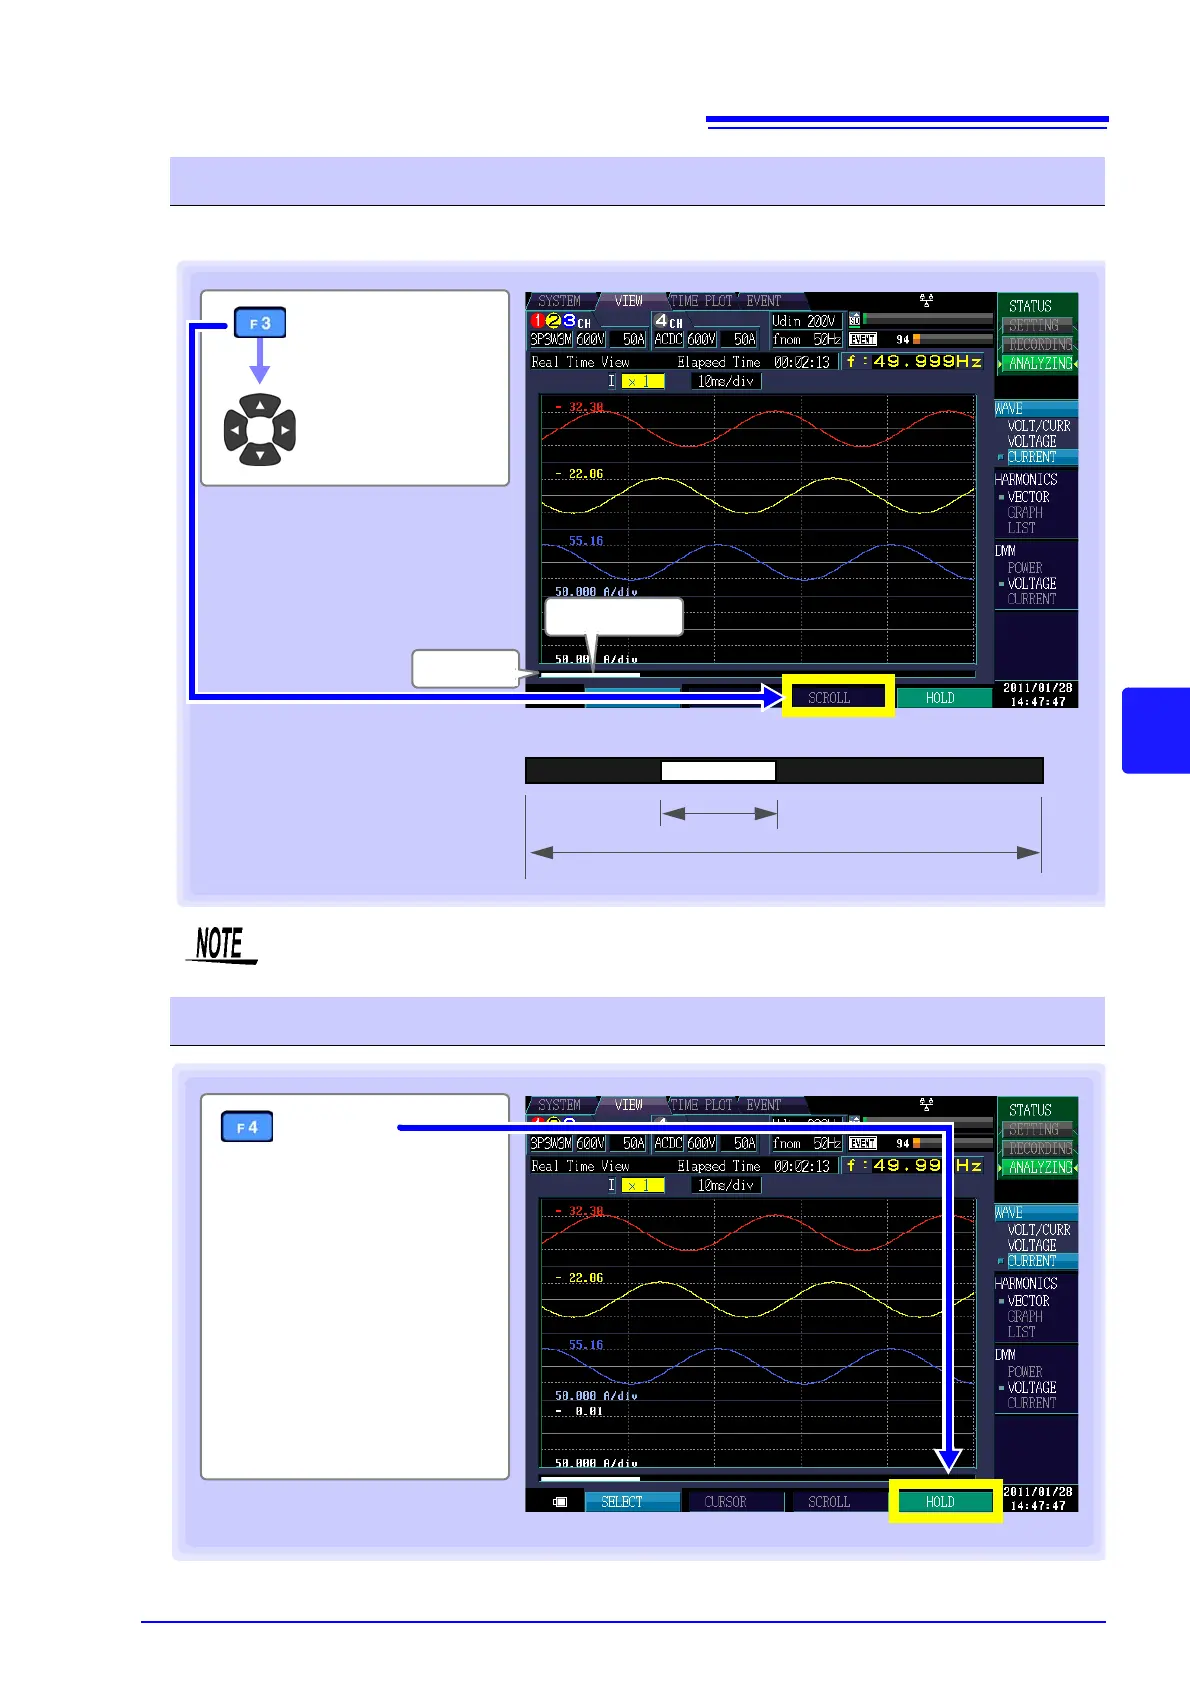
You can review all measurement data by scrolling horizontally.
Scrolling through the waveform
[SCROLL]
Scroll the
waveform
Scroll bar
Scroll bar
Display scope
All waveform data
The display scope on the scroll
bar (shown in white) illustrates
which range of all waveform data
is being shown on the screen.
Display scope
If you select an event and display a waveform, you can scroll horizontally to analyze 14
waveforms at 50 Hz, 16 waveforms at 60 Hz, or 112 waveforms at 400 Hz.
Holding the display
[HOLD]
(Measured values and
waveforms will be held.)