D2 Drive User Guide v1.8 6. Drive Tuning
HIWIN Mikrosystem Corp. 154
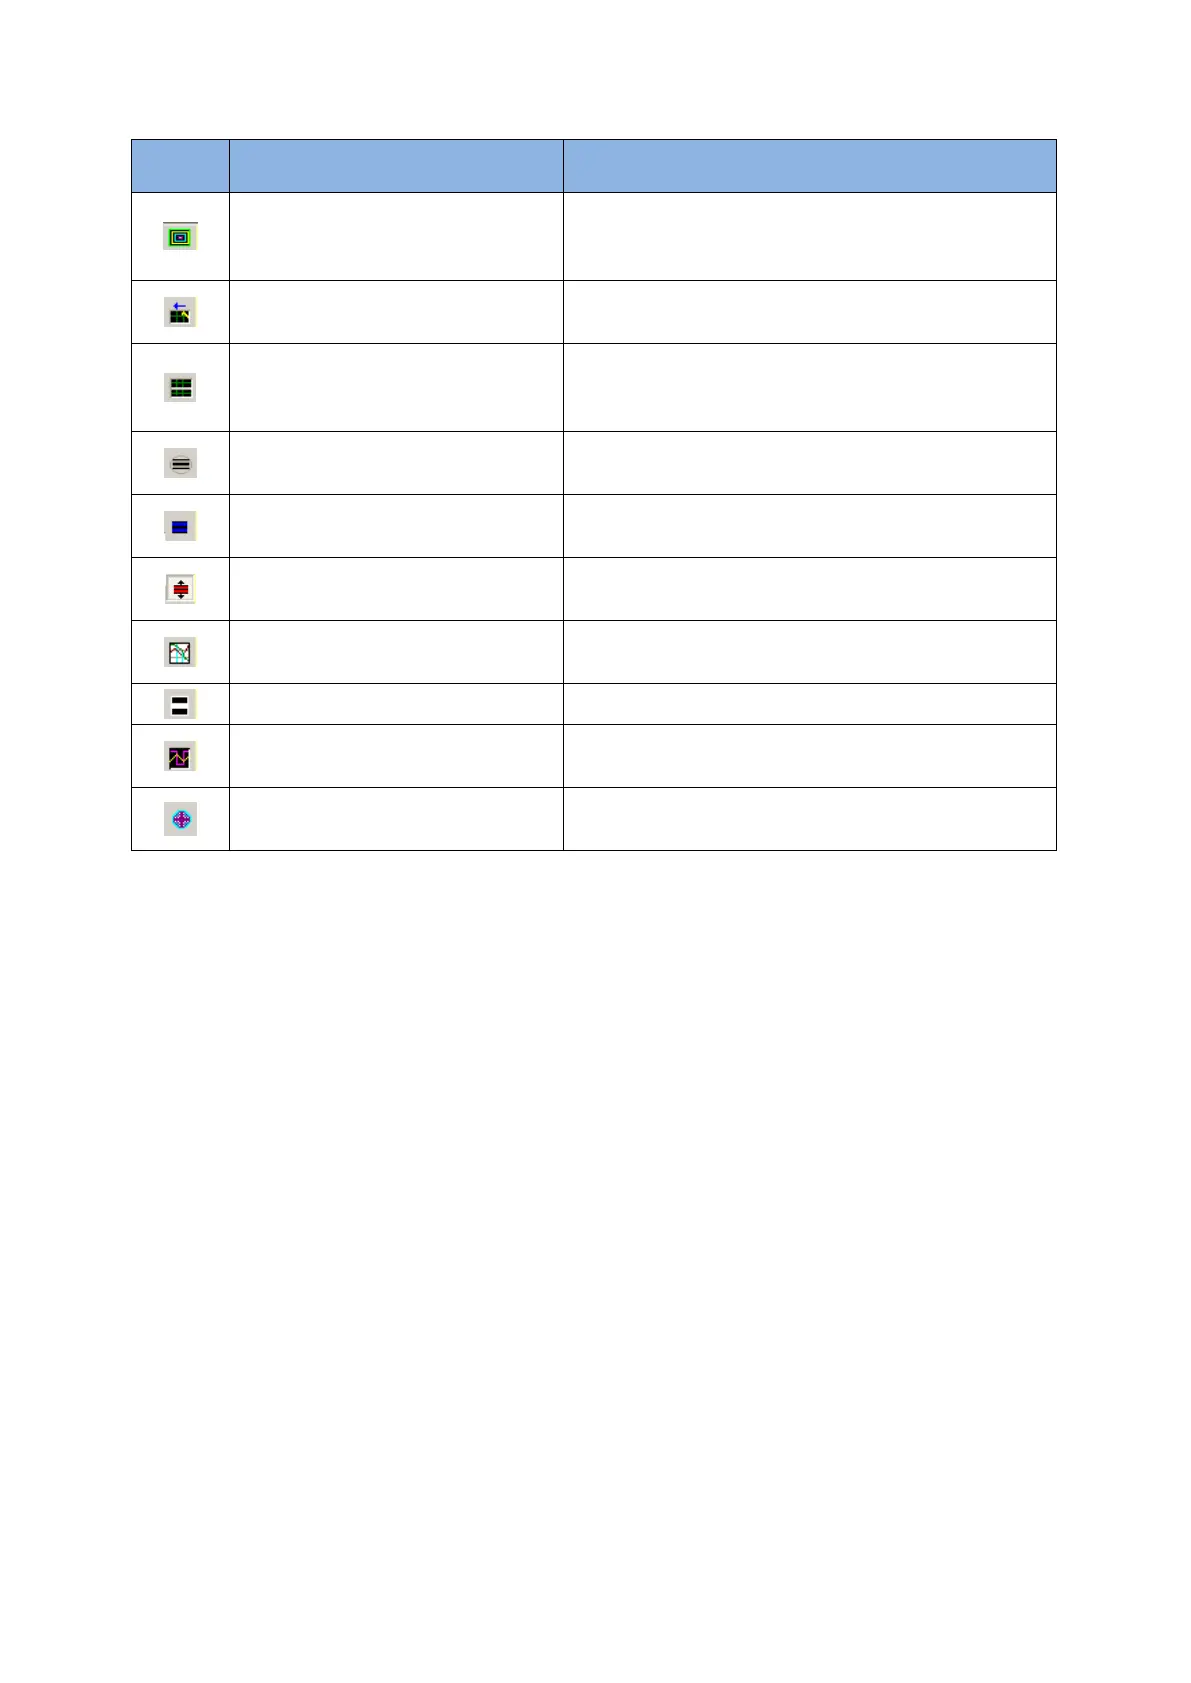
Table 6-1
The switch of “Scope”. When the switch is turned
off and then turned on, the scope will re-capture
the data.
View in paper mode (Ctrl+T)
Change the display waveform mode. There are
the “Normal” and “Paper” modes.
Toggle scopes window
(PageUp)
Display all selected physical quantities on a
single screen. Each click to switch a physical
quantity.
Adjust all physical quantities to the appropriate
scale.
Fit graph to window dynamically
Adjust all physical quantities to the appropriate
scale dynamically.
Fit graph to window dynamically
+ clip
Same as above, but the range of vertical axis will
only increase without reduction.
Show last data with plot view
tool
Use the “Plot view” tool to draw the data of
“Scope”.
“Scope” will re-capture the data.
Show all plots in same window
All physical quantities are drawn in the same
screen and share one vertical axis.
Connect physical quantities currently set by
“Scope” to the “Data collection” function.