4230 Flow Meter
Section 2 Programming
2-56
2.15 Step 9 -
Reports/History
This step lets you set up the flow meter to print periodic reports.
The typical report contains such information as the period of
time covered in the report, maximum and minimum levels, and
when they occurred. You can define two different reports in this
step. For example, this is used to provide weekly and monthly
reports. You can choose the content of the reports by working
through the menus in step 1.
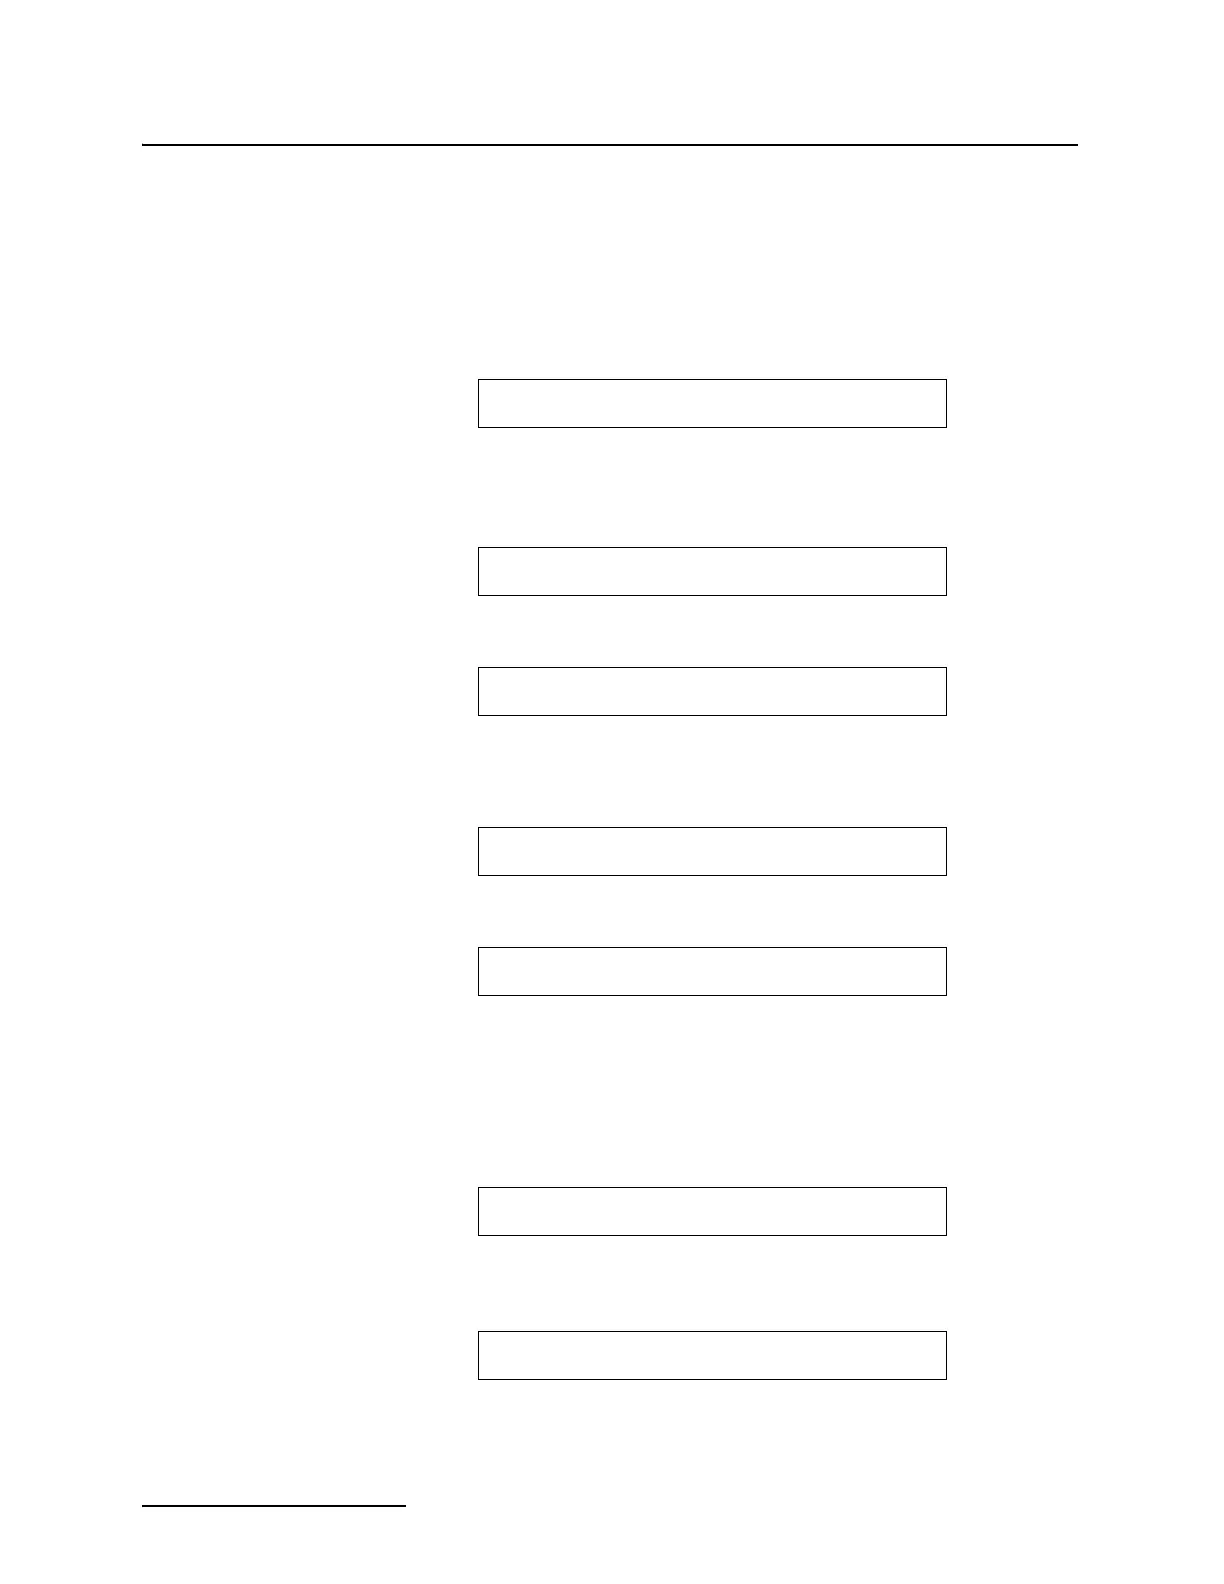
When you go to step 9, the following display will appear:
If you select OFF, the program will advance to the next step, and
there will be no report A generated. If you select YES, the fol-
lowing will appear:
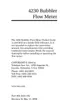
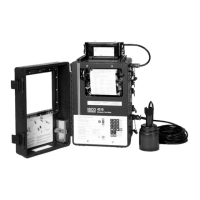
After you select the units of time, the following will appear.
DAYS or MONTHS could also appear depending on what you
selected for the previous step. The time selected becomes the
time interval that will be covered in the report. Then the flow
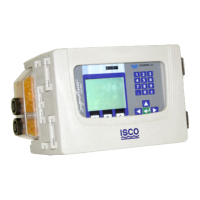
meter will ask you when you want the first report printed:
Then:
The second report generator lets you program the flow meter to
print two independent reports at different intervals, for example.
This is useful for those who need both a weekly and a monthly
summary of activity on the flow meter.
If you select OFF for this step, the program will advance to the
next step, and there will be no report B generated. If you select
YES, the following will appear:
Select the appropriate interval for this second report. After you
select the units of time the following will appear:
REPORT GENERATOR A
• ON • • OFF • • (PRINT) •
REPORT A DURATION TO BE IN
• HOURS • • DAYS • • MONTHS •
ENTER REPORT A DURATION
XX HOURS
PRINT REPORT A AT
YR: XXXX MONTH: XX DAY: XX HR: XX MIN: XX
REPORT GENERATOR B
• ON • • OFF • • (PRINT) •
REPORT B DURATION TO BE IN
• HOURS • • DAYS • • MONTHS •
ENTER REPORT B DURATION
XX HOURS