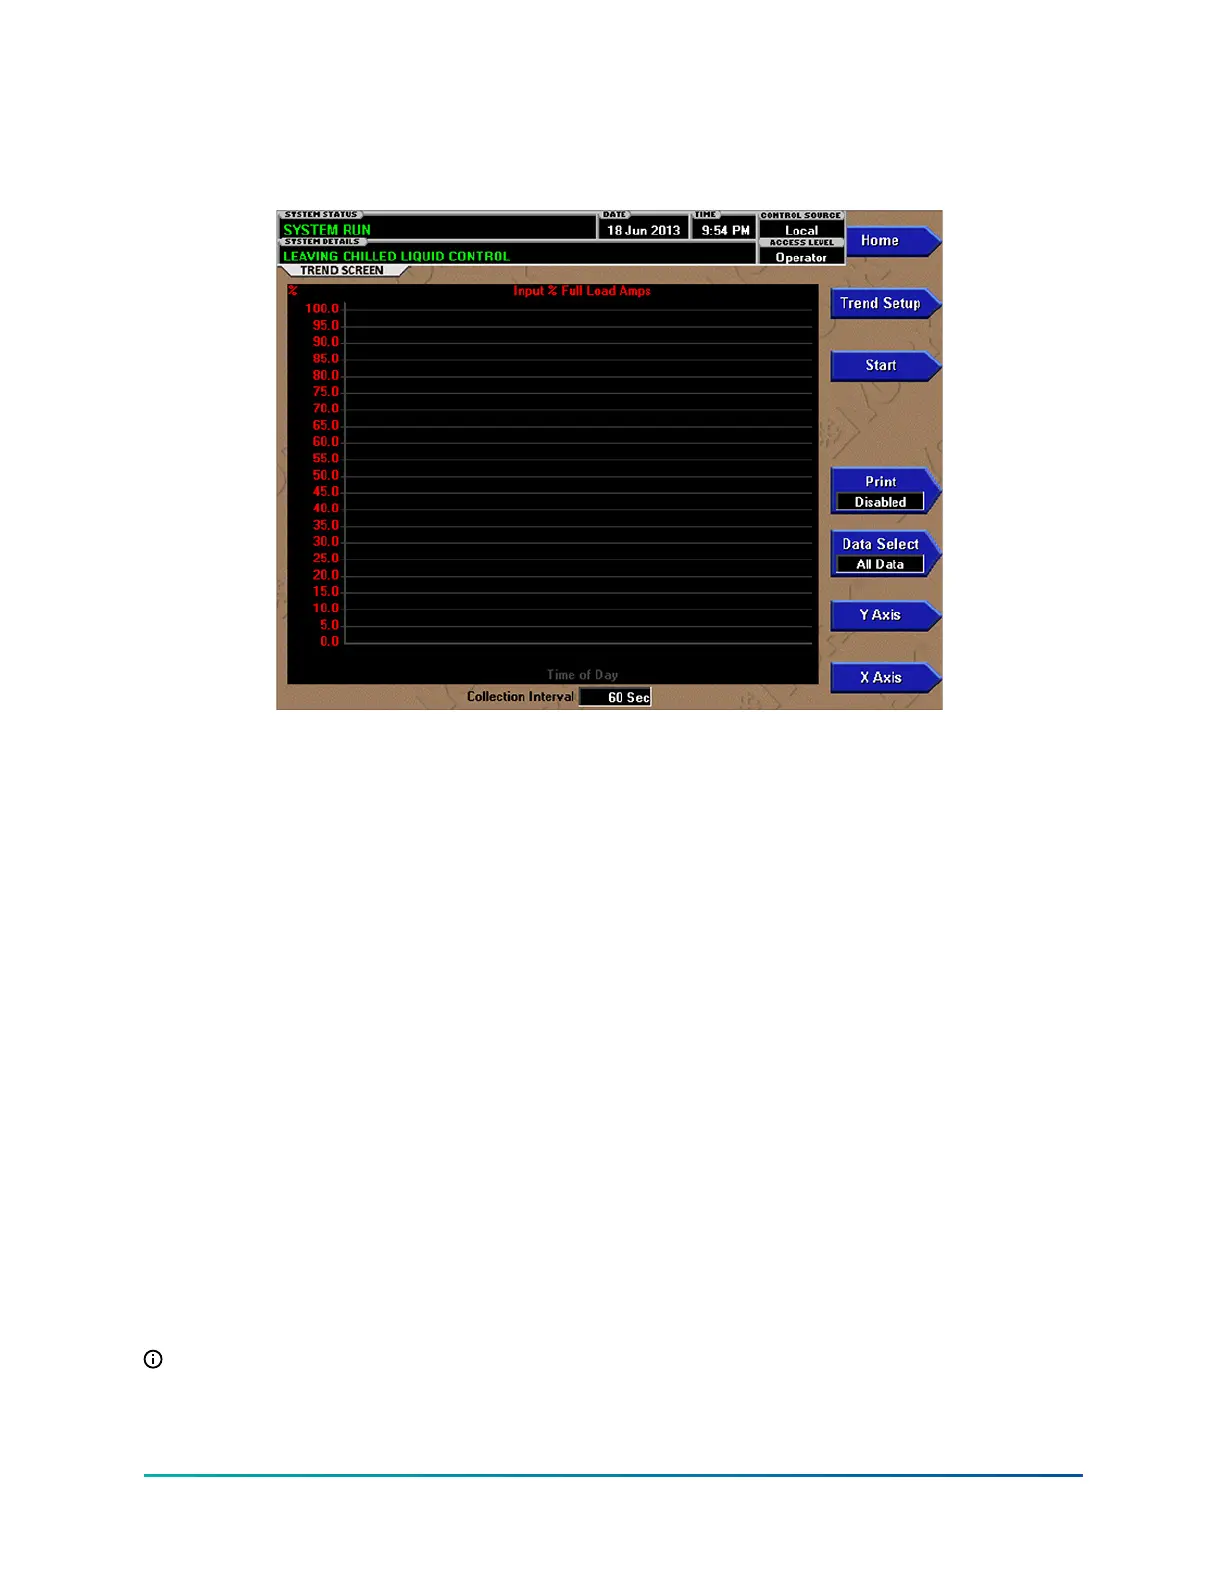
Trend screen
Figure 37: Trend screen
As many as six Operator selected parameters (data points) can be plotted in an X/Y graph format.
The X-axis is scaled to the selected Data Collection Interval and displayed in a time of day or
elapsed time format, as selected with the X-axis toggle key. The Y-axis is scaled, for each parameter,
to the selected minimum and maximum value for each parameter. Analog parameters are scaled
in pressure, temperature, volts, amps, hertz or time. Digital on/off parameters are scaled as zero
(off) and one (on). Only one Y-axis label is displayed at a time. The Y-axis Toggle Key is used to
toggle the Y-axis labels through the different parameters. The Y-axis label that is being displayed is
identified at the top of the graph. For identification, each plotted parameter and associated Y-axis
labeling is color coordinated.
The parameters are sampled at the selected Data Collection Interval and plotted using 450 data
points across the X-axis. If the actual value of the sampled parameter is less than the Y-axis label
minimum for that parameter, the value will be plotted at the minimum value. Similarly, if the actual
value is greater than the Y-axis label maximum for that parameter, the value will be plotted at the
maximum value.
• ONE SCREEN
• CONTINUOUS
• TRIGGERED
If a power failure occurs while the trending is running, the trending is stopped. Upon restoration
of power, the last screen of data that was collected will be displayed on the trending screen. The
START key must be pressed to initiate a new trend screen.
This screen allows the user to view the graphical trending of the selected parameters and is also a
gateway to the graph setup screens.
Note: A red screen with the words TREND MAX MUST BE > TREND MIN will appear if the Y-Axis
minimum has been programmed to a value that is greater than the Y-Axis maximum for any
parameter. If this appears, proceed to the Trend Setup Screen to change the values.
93
YMC
2
Mod B with OptiView
™
Control Center