[Limit maximum] and [Limit minimum]
Here you can define the upper and lower temperature value of the
graph window (corresponds to scaling of y axis).
Note: When setting the two limit values manually, make sure that
the temperature curves fall within the range of the two limit values,
otherwise the temperature curves will not appear on the graph. You
must enter the absolute temperature values.
[Tolerance range of graph]: A graphic tolerance range curve T
set
can
be defined around the temperature and displayed to visually assist the
control accuracy of the displayed temperature curve T
set
.
Touch the [Display tolerance range] button to change the settings.
Placing or removing a checkmark next to the [Display tolerance
range] button shows and hides the tolerance range in the graph
window.
Touching the [Maximum limit value tolerance range] or [Minimum
limit value tolerance range] button opens the input window.
Enter a positive and a negative distance to the set point T
set
for the
tolerance range around the temperature curve.
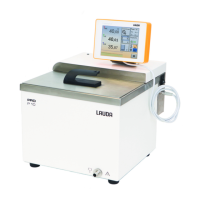
V6
PRO bath thermostats and circulation thermostats70 / 156