CP5 • System description
CP_SEM_60-00-60.001 27
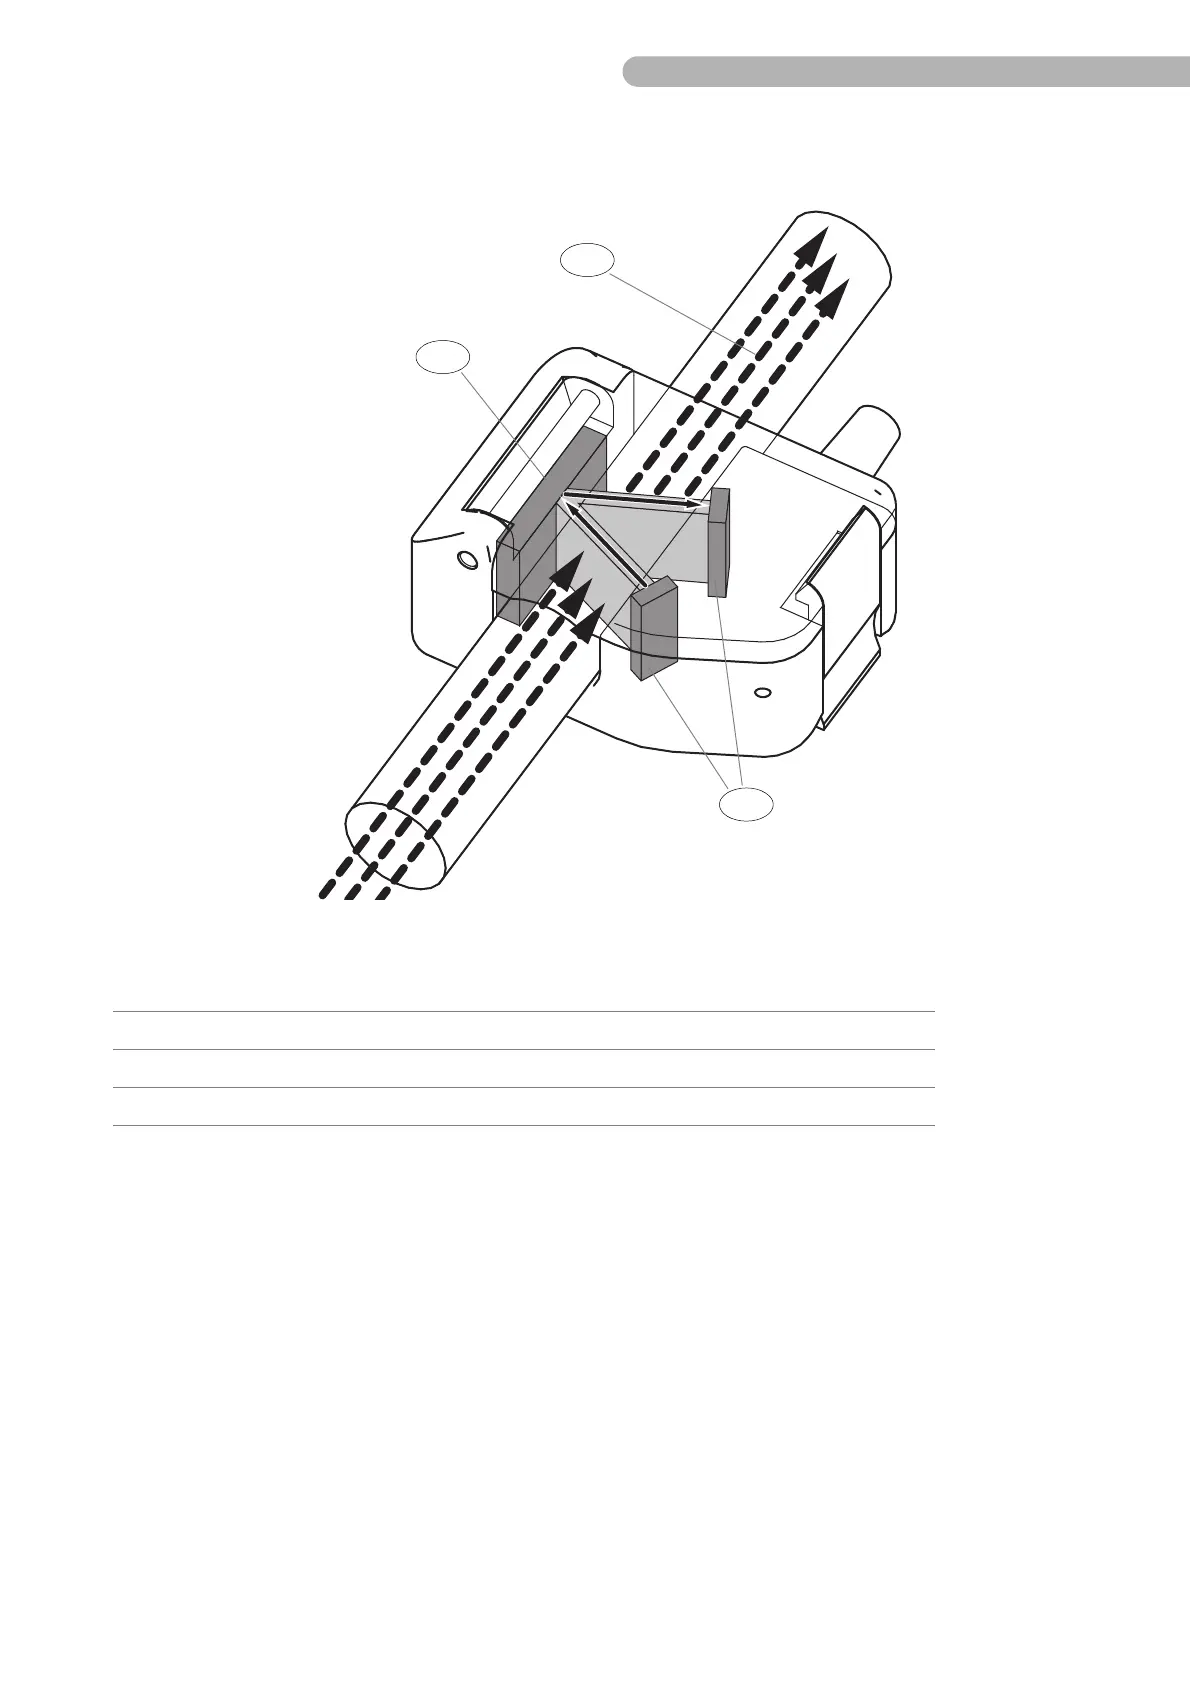
3.3.2 Functional diagram of flow probe
Fig. 11: Functional diagram of flow probe (1)
The flow rate is measured by two ultrasound transducers a in the flow probe. These emit an ultrasound
signal twice in alternation, which passes through the tube c (i.e. the liquid contained) via a reflector b.
Depending on the mean speed of the liquid, the ultrasound signal undergoes a change in the transit
time (and thus produces a phase shift from the original signal).
This dual transit is produced by alternating control of the transducers, once with and once against the
direction of flow, generating different transit times for the reflected ultrasound signals. The absolute
flow rate can be determined from these two values, but only the signals (which pass through the tube)
with an actual change in the transit time are included in the evaluation. The flow rate can thus always
be calculated correctly, irrespective of the tube diameter.
Item Name
a Ultrasound transducers (2 x transmitter/receiver)
b Reflector
c Inserted and filled tube