41
User Manual
the previous levels is identified by a dotted pattern. When the cursor is moved on an
area not covered by data of the current level the chartplotter zooms out to the first
level covered by cartographic data. The default setting is Off.
Note
The Mixing Levels function works only with the new
C-CARDs. It also affects the speed of the
redraw of the screen. If this function is not used it maybe disabled.
3.5.1.8 Safety Status Bar (DSI - Data Safety Indicator)
'MENU' + "MAP SETTINGS" +'ENTER' + "Safety Status Bar" + 'ENTER'
It is possible to choose between the three following options:
• ON : the Safety Status Bar is shown
• OFF : the Safety Status Bar is not shown
• ICON : the Safety Status Bar is not shown, but a warning alarm icon
is shown on the corner of the map screen as soon as any item
controlled by the DSI function returns an alarm condition.
The Warning Icon remains displayed until the alarm condi-
tion persists. Placing the cursor over it, a quick help message
is shown next to the DSI icon, allowing to show the DSI bar.
In this case - when the DSI bar is opened via DSI alarm icon -
it is allowed to obtain information about each “active” DSI
box (the red ones): it is possible to select them by cursor move-
ment left/right, and a list of active alarms is shown under-
neath the selected box. By pressing 'CLEAR', the DSI bar is
removed from the screen.
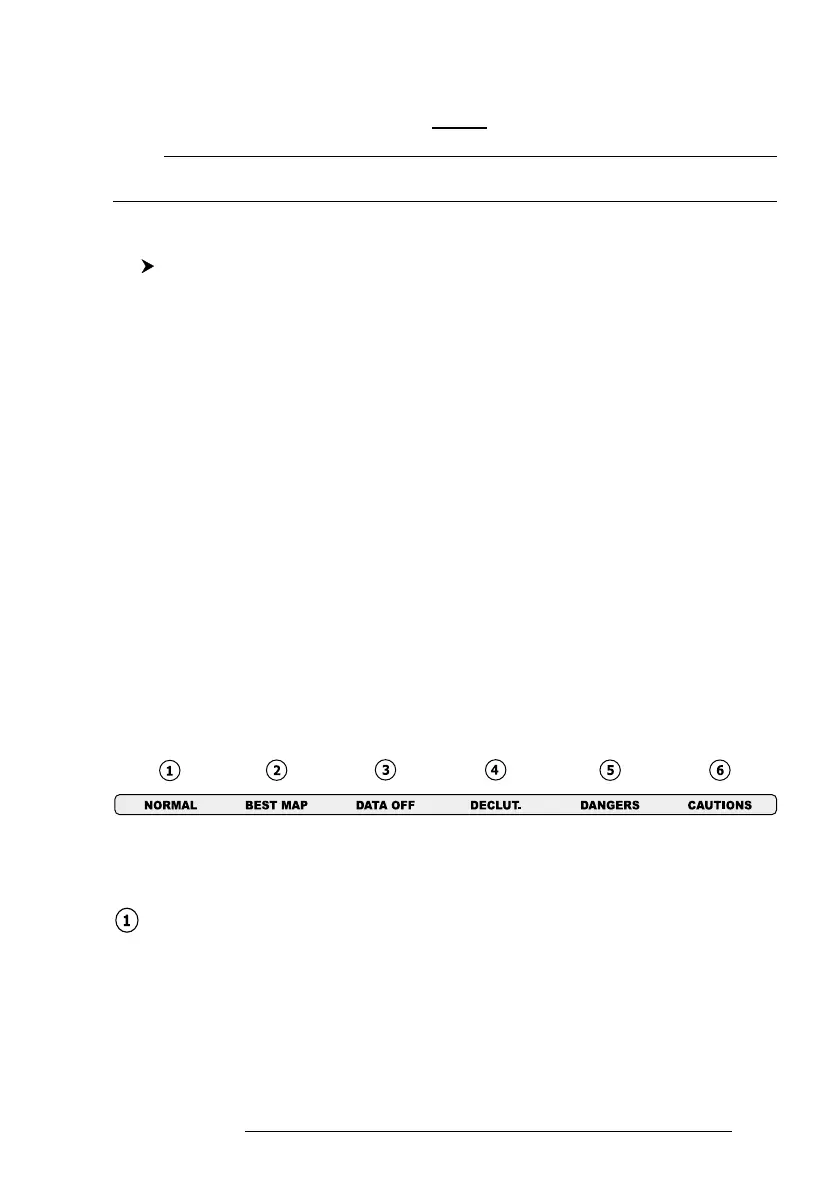
When Safety Status Bar is On, this feature displays a status bar with six boxes
showing the status of certain functions. Any warning or alarm condition is identified
by the red color to indicate possible risk.
Fig. 3.5.1.8 - Safety Status Bar
Boxes definition is as follows:
Zoom
- Normal: when the chart is displayed at normal scale.
- U. Zoom: red when the chart is under-zoomed out more than twice nor-
mal scale, gray otherwise.
- O. Zoom: red when the chart is over-zoomed in more than twice normal
scale, gray otherwise.