3 Press the left hand mouse key.
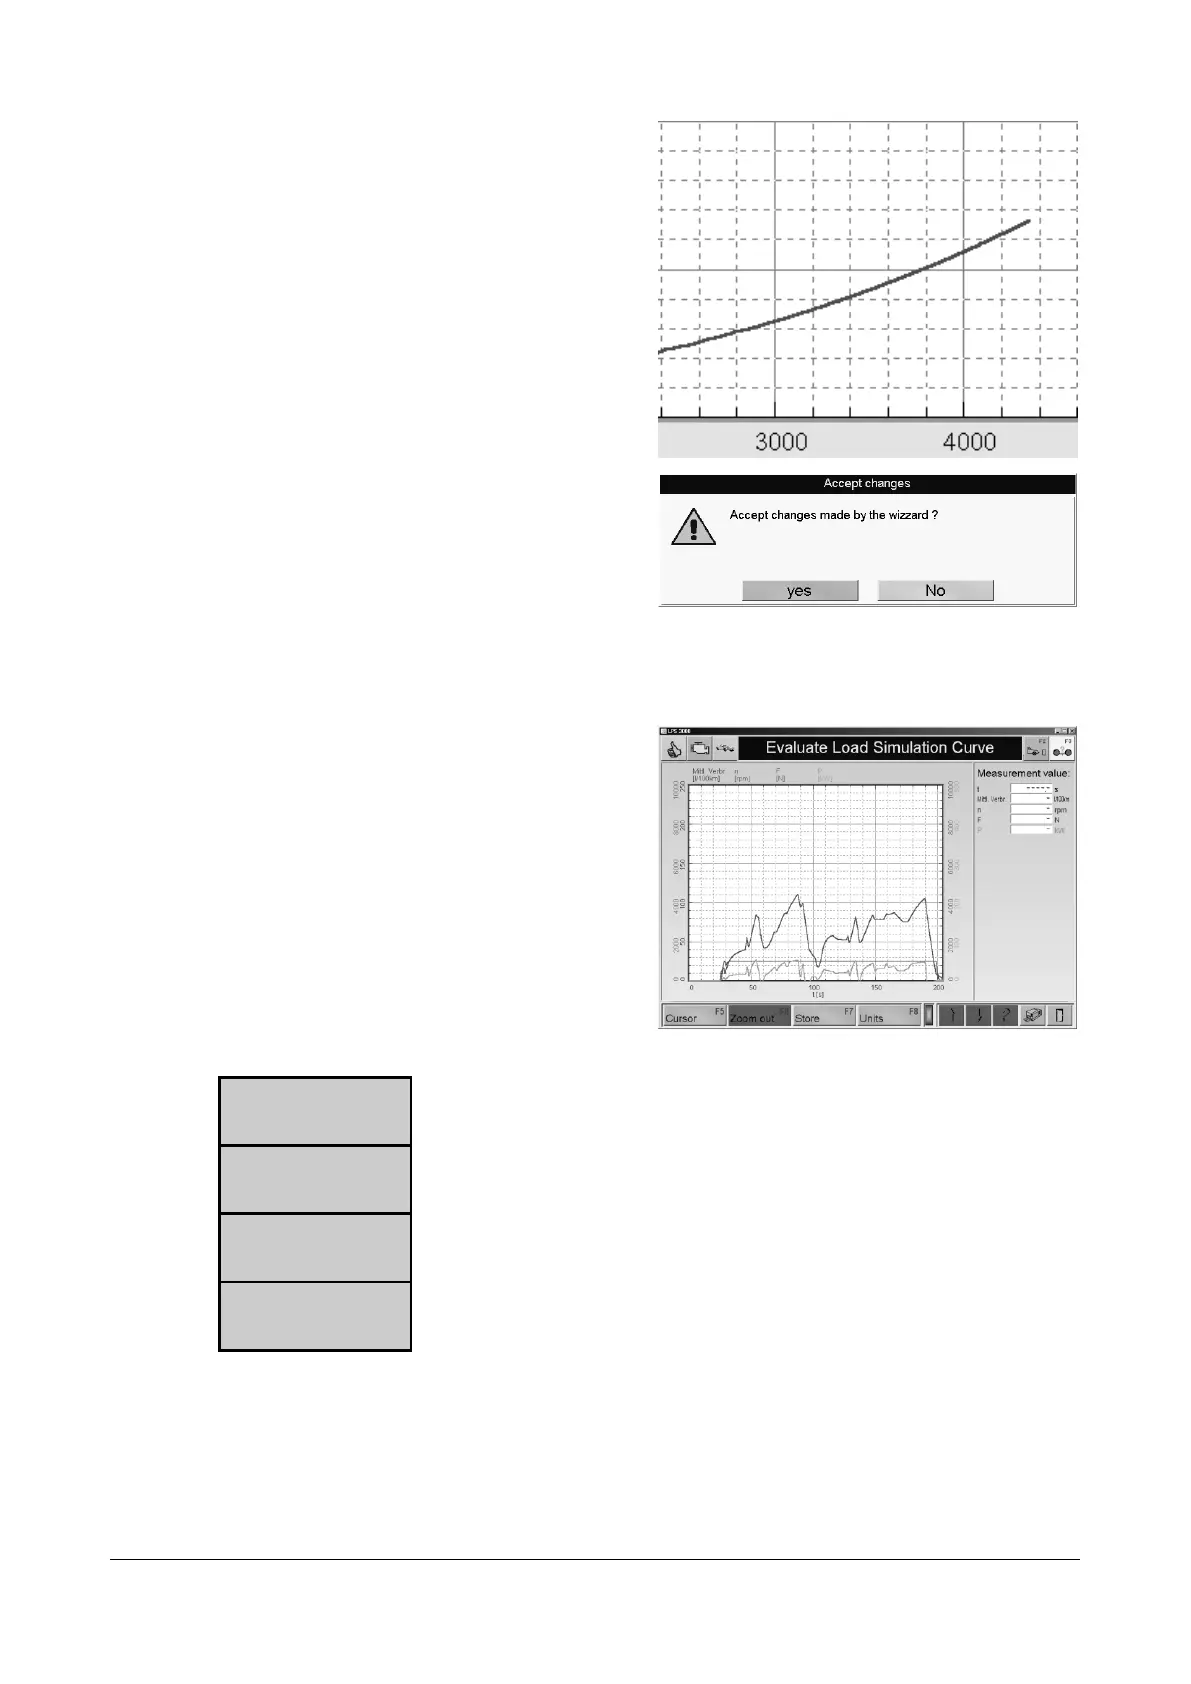
→ The curve is smoothed by interpolating.The
interpolation is only done on the upper half
of the curve.
4 Use the button <F7 END WIZARD >.
→ The following window appears:
5 Select YES to store the changes, if not,
select NO.
1 Call up the menu DATABASE and then
menu point TIME DIAGRAM
The database Browser appears:
2 Select a dataset with the cursor key or the
mouse.
3 Open the dataset by double clicking or
press the <ENTER> key.
The measurement screen appears.
• Use this button to blend the cursor in and out.
The cursor can be moved using the mouse key.
• Use this button to display the original picture again, step by step,
(see paragraph "Zoom-Function" in Chapter "Measurements").
• Use this button to store the vehicle and customer data (see Chapter 6,
Paragraph "Identical Functions" and function "Store").
• Use this button to change the units.
(see paragraph "Units" in Chapter "Settings").