User Manual
Page 52
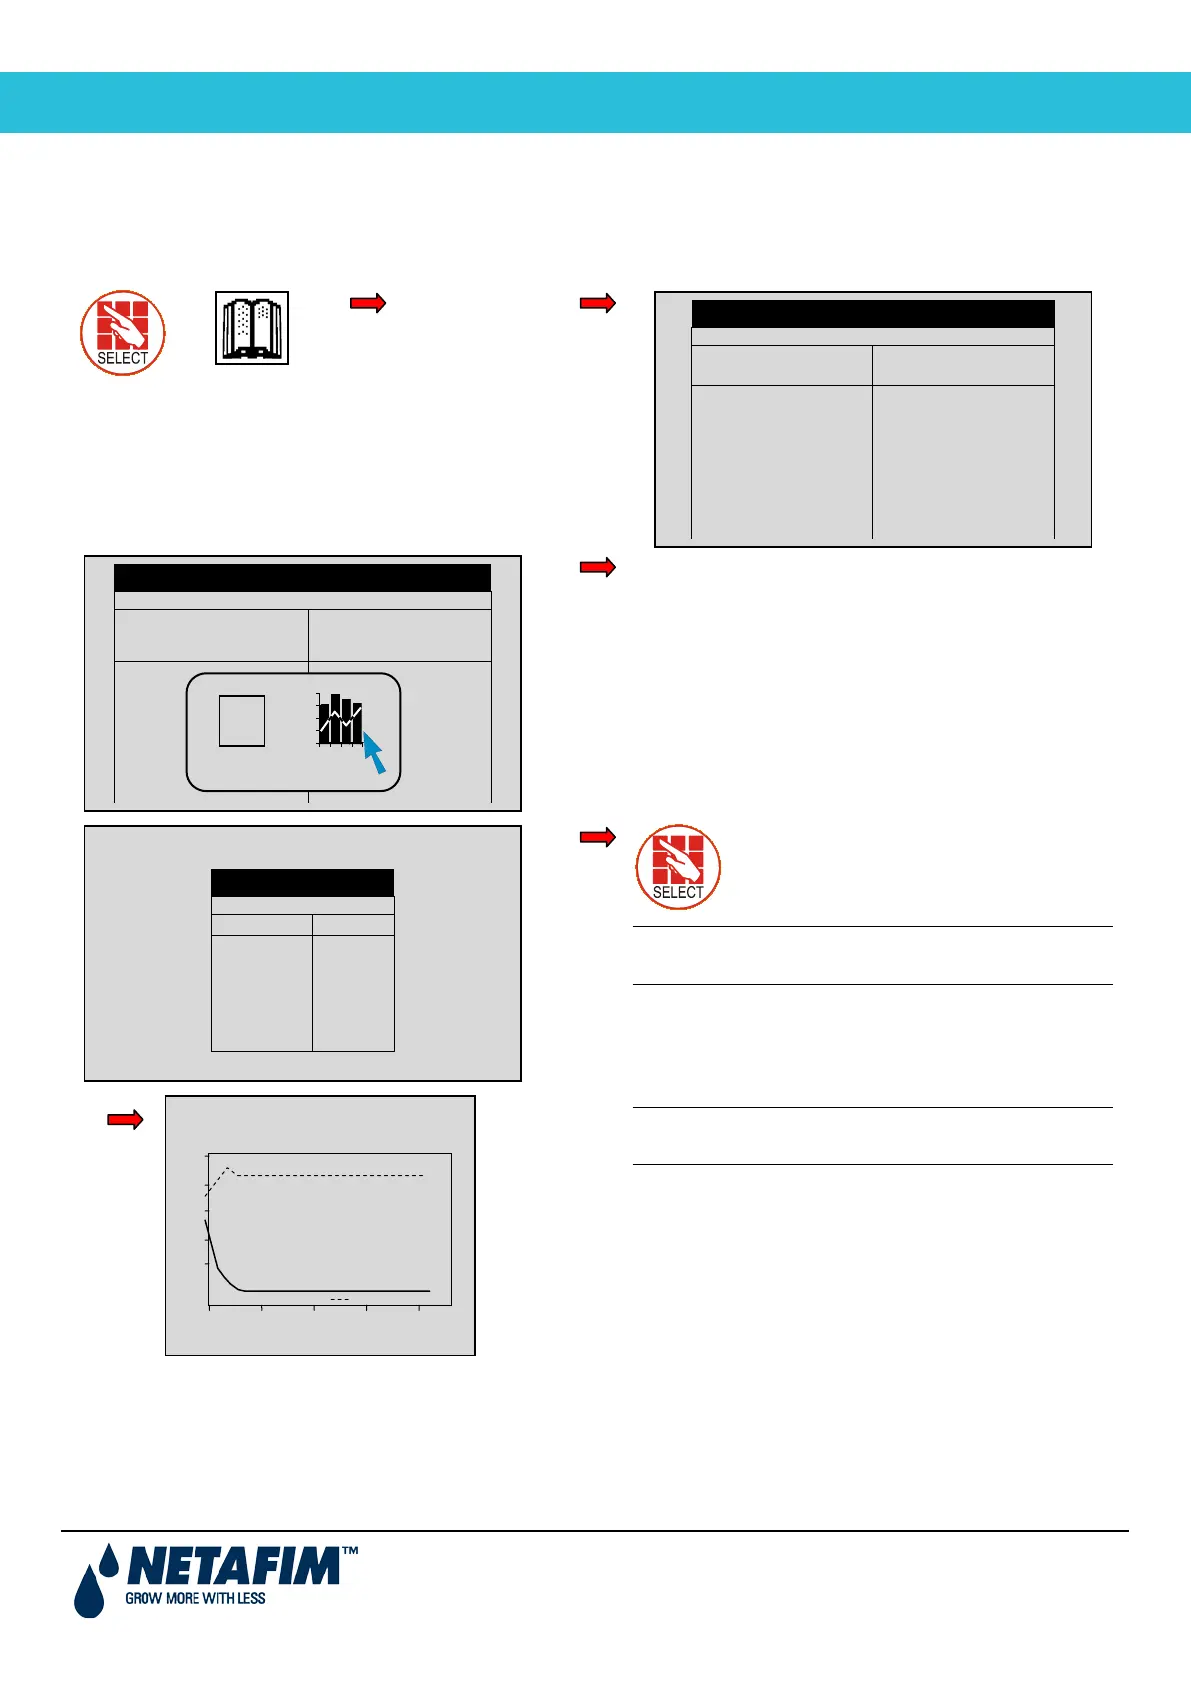
5 4BHISTORY MENU
The History Menu consists of read-only screens detailing the system's history data (measurements, settings,
processes, events, graphs and so forth). The History Menu provides extensive information regarding measurements
and processes performed by the NMC-Pro.
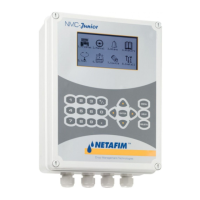
Select sensors using +/- key (no more than 3 per
graph)
Menu
Note: Press the Mode/Zone Key to view the
graphs.
Note: Use arrow keys to zoom in/out. Use
arrow keys to scroll.
5.0
4.0
3.0
2.0
1.0
16:00 16:00 14:00 12:00 09:00
25/04 22/04 22/04 22/04 22/04
GRAPH SELECT
Avg.
Temp
Avg.
Hum.
-EC-
-pH-
∙
∙
√
√
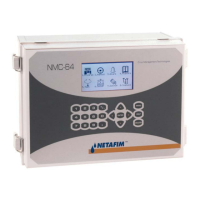
SENSORS LOG
Date
Hum.
pH-
25/Apr
25/Apr
25/Apr
22/Apr
22/Apr
22/Apr
22/Apr
16:00
15:00
14:00
16:00
16:00
15:00
15:00
----
----
----
----
----
----
----
3.0
1.4
1.1
1.0
1.0
1.0
1.0
4.1
4.8
5.4
5.1
5.1
5.1
5.1
SENSORS LOG
Date
Time Avg.
Hum.
-EC-
-
pH-
25/Apr
25/Apr
25/Apr
22/Apr
22/Apr
22/Apr
16:00
15:00
14:00
16:00
16:00
15:00
----
----
----
----
----
----
3.0
1.4
1.1
1.0
1.0
1.0
4.1
4.8
5.4
5.1
5.1
5.1
Help Graph