User Manual
Page 53
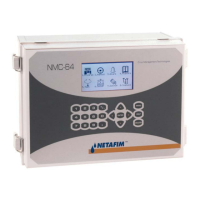
5.1 37BIrrigation Log
• The Irrigation Log table includes up to 200 rows of the last irrigations' data. Each row includes information
regarding a specific irrigation.
To view additional information, use the left/right arrow keys.
To switch between dosing quantities or time simply press the ‘+/-‘ key.
Note: Water quantity is measured in m³ or gallons; duration is measured by time; flow is measured in m³/h or
gallon/m; dosing quantity is measured in liters or gallons.
Item Description
Date Date in which the irrigation started.
Time Time in which the irrigation started.
Valve Leading valve; the first valve set for the group of valves
Reason Specification of the irrigation triggers; time, condition, Rad Sum, etc.
Water Irrigation quantity (m³ or gallon) or irrigation time.
Duration Irrigation duration (hh:mm:ss).
Flow Average flow throughout the irrigation cycle.
Chan. # Dosing quantities per channel (liter or gallon) or dosing time.
EC Low Lowest EC value recorded during irrigation.
EC Avg. Average EC value recorded during irrigation.
EC High Highest EC value recorded during irrigation.
pH Low Lowest pH value recorded during irrigation.
pH Avg. Average pH value recorded during irrigation.
pH High Highest pH value recorded during irrigation.
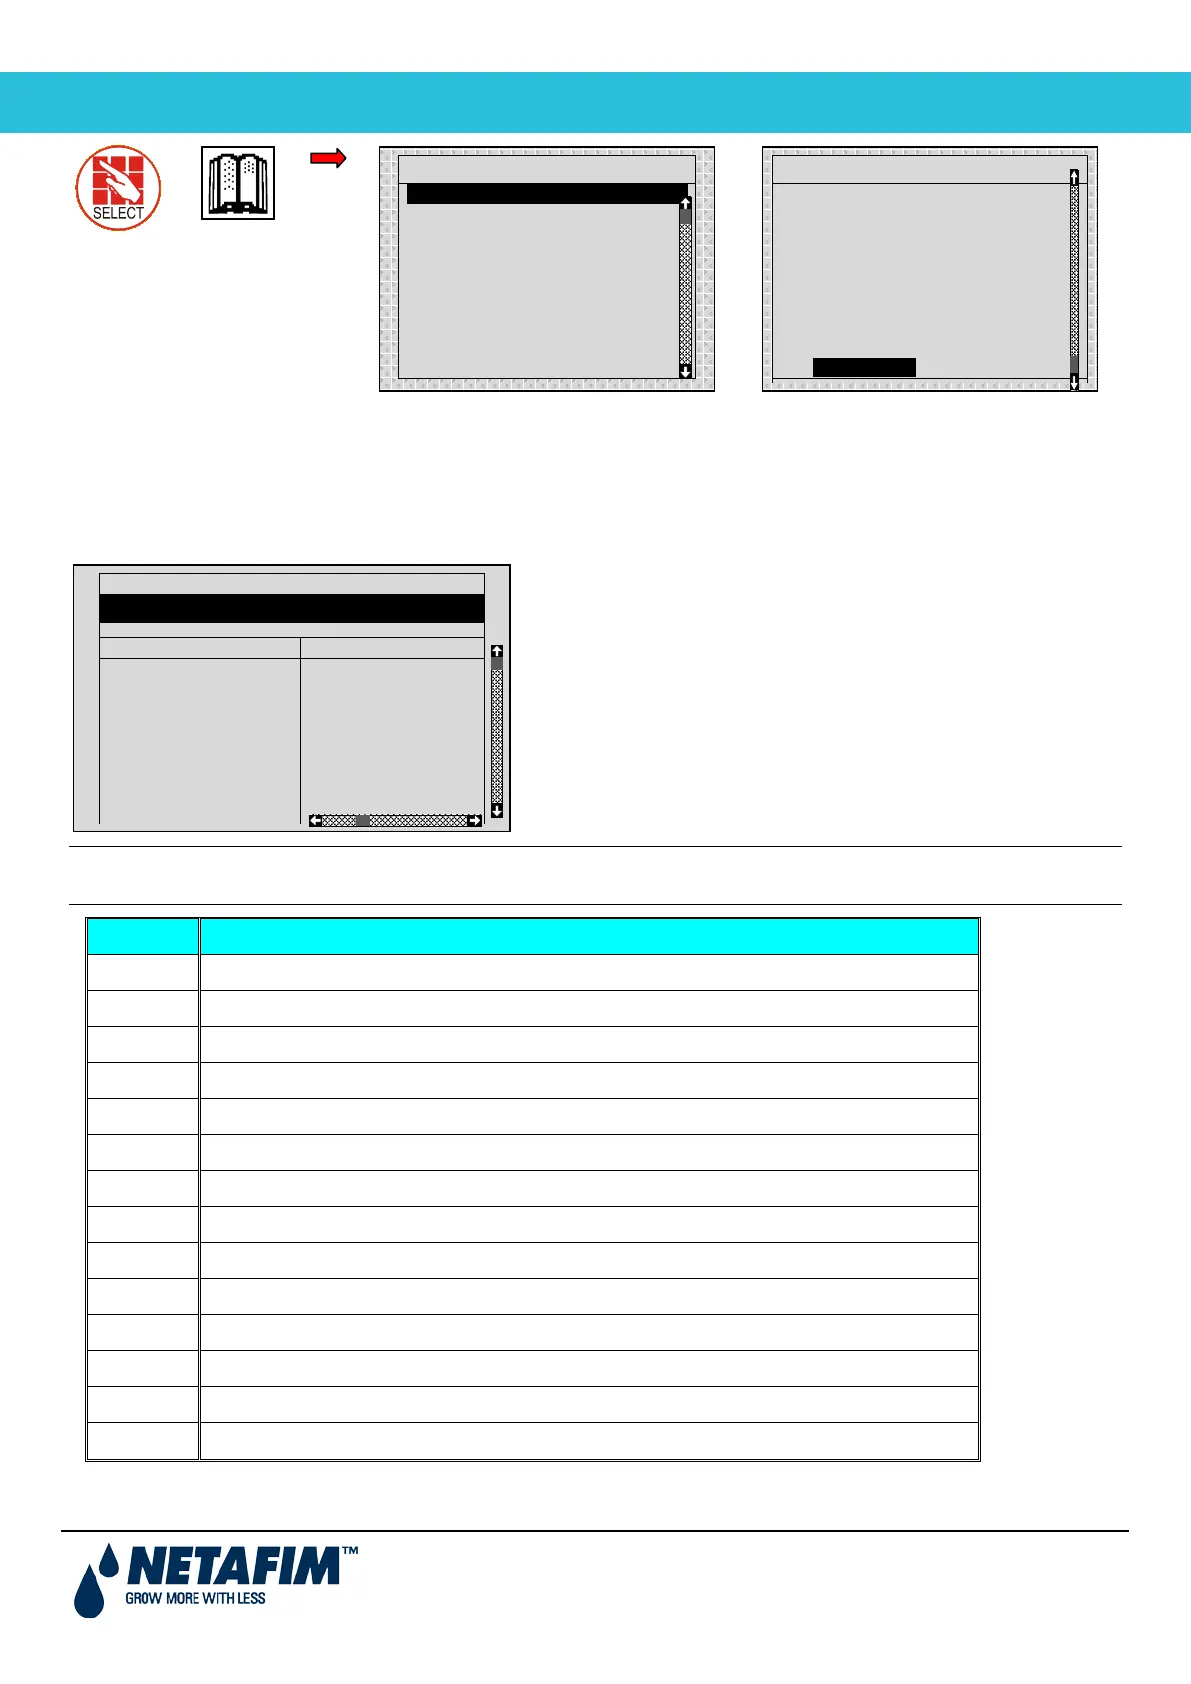
HISTORY
2. RAD. & VPD SUM & DRAIN LOG
3. UNCOMPLETED IRRIGATION
4. UNCOMPLETED PROGRAMS
5. DAILY IRRIGATION
6. IRRIGATION ACCUMULATION
7. AUX METER ACCUMULATION
8. ACCUMULATION RESET
9. FILTERS
10. COOLING
HISTORY
5. DAILY IRRIGATION
6. IRRIGATION ACCUMULATION
7. AUX METER ACCUMULATION
8. ACCUMULATION RESET
9. FILTERS
10. COOLING
11. SENSORS LOG
12. EVENT LOG
13. SYSTEM LOG
DATE : 24-Dec-06 TIME : 17:17:20
IRRIGATION LOG
23/Dec
23/Dec
23/Dec
23/Dec
24/Dec
24/Dec
24/Dec
17:32
17:42
17:52
18:02
14:50
15;00
15:10
254
217
115
219
255
254
217
2.63
3.58
3.41
2.64
3.58
2.63
3.57
2.81
3.59
3.44
2.81
3.59
2.81
3.60